

1. INTRODUCTION
2. EXPERIMENTAL SETUP AND PROCEDURE
3. RELATIONSHIPS BETWEEN LIDAR INTENSITY AND THE PARAMETERS
3.1 Scanning distance
3.2 Incidence angle
3.3 Surface roughness
3.4 Water condition
3.5 Physical and mechanical properties
3.6 Mineral composition
3.7 Color information
3.8 Summary
4. CONCLUSIONS
1. INTRODUCTION
Rock mass characterization and classification based on hand-mapping survey has potential limitations of application that come from human bias, limited accessibility, and extensive time required. To overcome the limitations, the application of photogrammetry and LiDAR (Light Detection and Ranging) technologies has been increased lately. Both technologies are usually effective to characterize rock mass discontinuities, but they are limitedly used to characterize alteration and weathering of rock mass, of which the information is essential for rock mass classification. In this study, a fundamental investigation was made on how to use LiDAR technology to determine the degree of weathering and alteration of rock mass.
LiDAR is a remote sensing/measurement tool developed to obtain the precise three-dimensional coordinates of a target by measuring the distance from the sensor to the target by measuring the time a laser beam takes to return. The state-of-the-art technology of LiDAR can be applied in many engineering disciplines including architecture, geology, civil and mining engineering. The intensity of the reflection of the LiDAR represents the strength of the reflected signal. LiDAR intensity is known to have a relationship with surface condition of rock mass. Thus, the measured intensity may represent the weathering or alteration degree of rock mass.
Ercoli et al. (2013) found the reflectivity of a laser scanner could be used for measuring the degree of weathering of old architecture. The study presented a correlation between the Schmidt hammer rebound values and the reflectivity on the surface that was detected by means of terrestrial scanner laser. Accordingly, the result demonstrated that such an investigation could be a significant alternative as an innovative and non-destructive technique. Fowler et al. (2011) found that the detection of weathering and a significant advancement in material classification could be conducted using LiDAR reflectance as shown in Figure 1. It was possible to discern a slight change in the colorization of the wall shown in the boxed area of interest in Figure 1(a). However, further inspection by LiDAR (Riegl VZ-400) revealed that the area of interest was highlighting a highly reflective material shown in red, whereas the surrounding area was seen in yellow. In this way, the area of interest demonstrated that fresh rock can be extensively discerned through LiDAR reflectance data.
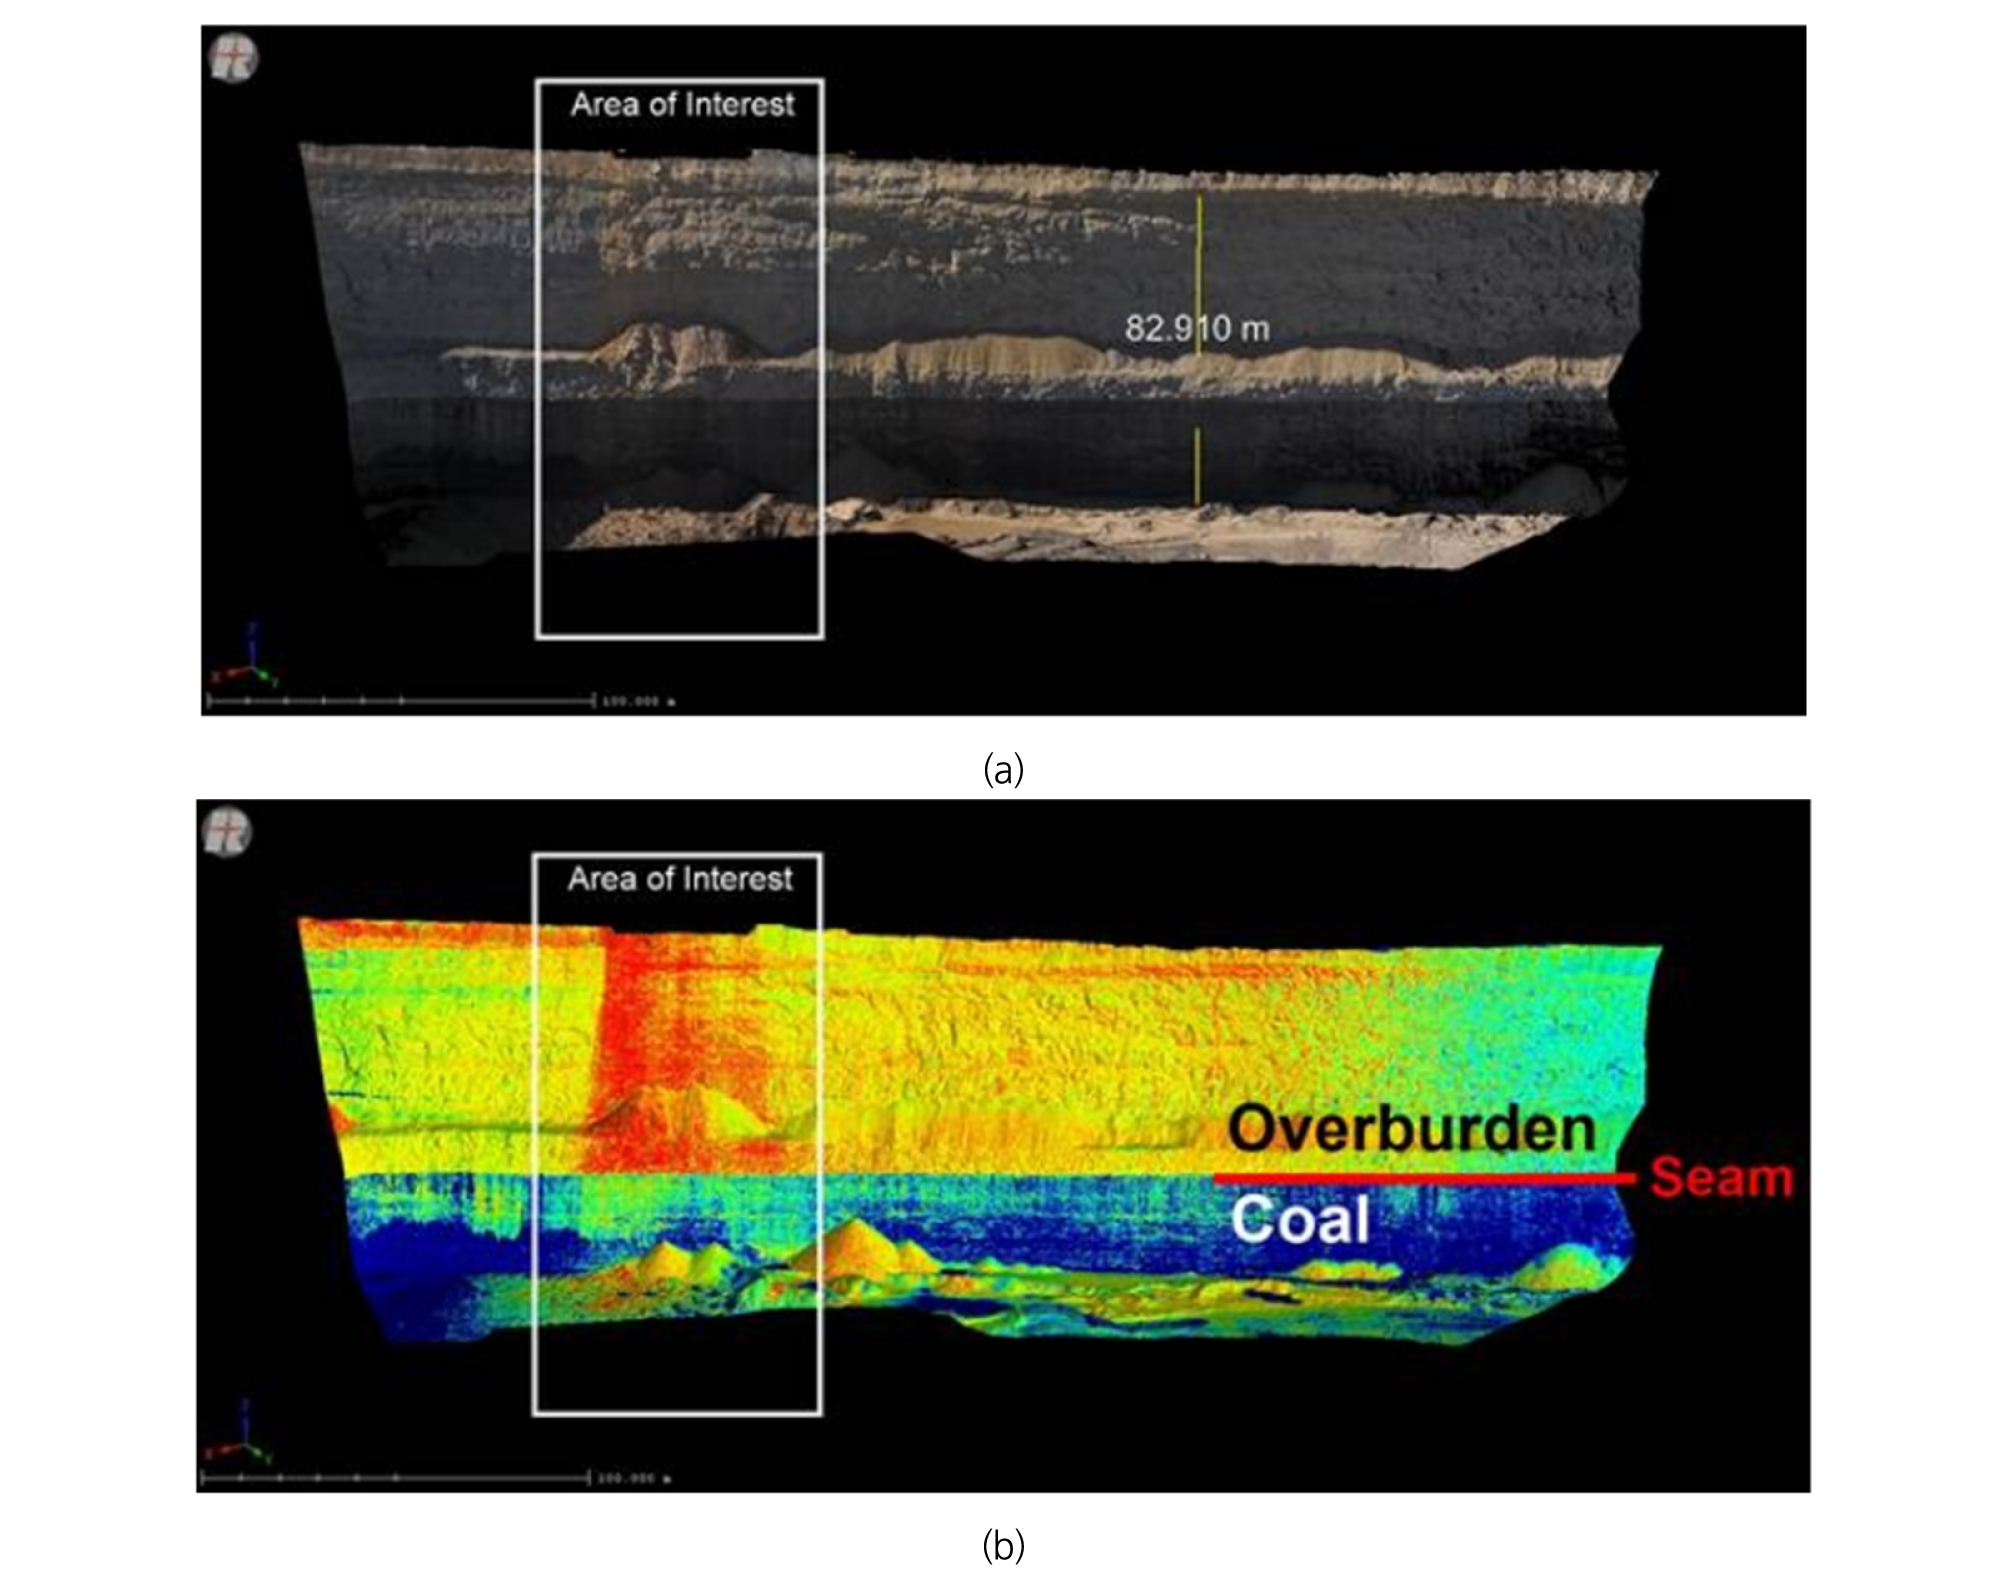
Fig. 1.
Coal mine high wall mesh: (a) colorized by close range photogrammetry, and (b) colorized by relative reflectance of LiDAR (Fowler et al., 2011)
Intensity is a measure, collected from each and every target point, of the return strength of the laser pulse. It is based, in part, on the reflectivity of the object struck by the laser pulse. The intensity of the laser pulse reaching the receiver is recorded as a digital number (DN) in the LiDAR recording device. In the study by Coren et al. (2006), the DN can be defined as the ratio of the number of photons reaching the receiver to the number of photons emitted from a LiDAR unit at a given target point, which physically denotes the strength of reflectance. The intensity can be considered to be mainly affected by factors such as the reflectance of the target, atmospheric transmittance, and the scanning distance.
Shin (2007) proposed LiDAR intensity as depicted in Equation (1).
| $$P_r=\rho\frac{M^2D_r^2D_{tar}^2}{4R^2({R\gamma}+D)}P_T$$ | (1) |
Equation (1) shows that the intensity of the laser reaching the receiver (Pr) is related to target reflectance (ρ), atmospheric transmittance (M), receiver caliber (Dr), target diameter (Dtar), scanning distance (R), laser divergence (γ), the laser aperture (D), and the strength of the original laser (PT). Burton et al. (2011) proposed a linear relationship between LiDAR intensity and mineral composition. According to the study, intensity was proportional to the sum of quartz, plagioclase, and K-feldspar content. Clay composition was inversely proportional to intensity. Pesci et al. (2006) used the intensity of the laser to map and identify multiple layer units exposed upon the walls of a volcanic crater. According to the research, the intensity was closely related to the physical and chemical properties of the reflective object. They also noted that stratigraphic studies using LiDAR intensity can be extended to areas other than volcanic environments. Bellian et al. (2005) studied the detection of rock deformation using intensity along with other properties. Klise et al. (2009) showed that intensity and multi-scan stacking can easily distinguish gravel from sand. Another recent study showed an inverse linear correlation between strength and the clay content (percentage of hydrogen weight) in rocks dominated by carbonate (Franceschi et al. 2009). All these studies point to LiDAR intensity as a potential quantity for identifying the characteristics of rock mass. Consequently, understanding relationships between LiDAR intensity and rock properties will improve the merits of LiDAR application in rock engineering researches and projects.
The objective of this study is to ascertain what factors directly affect LiDAR intensity and the degree to which they affect LiDAR intensity. Referring past studies on LiDAR intensity (Yoo et al., 2015, Burton et al., 2011, Ercoli et al., 2013, Franceschi et al., 2009), it is evident that scanning distance, incidence angle, water condition, and surface color (in RGB) are the factors that influence LiDAR intensity. But, additional factors such as surface hardness and roughness need to be considered for the application in rock engineering. In this study, a series of experiment were conducted to quantitatively obtain the relationship between LiDAR intensity and not only distance, incidence angle, color in RGB, water condition, but also roughness, mechanical/physical properties of rocks, i.e. uniaxial compressive strength (UCS), p- and s-wave velocity, and porosity, and mineral composition.
2. EXPERIMENTAL SETUP AND PROCEDURE
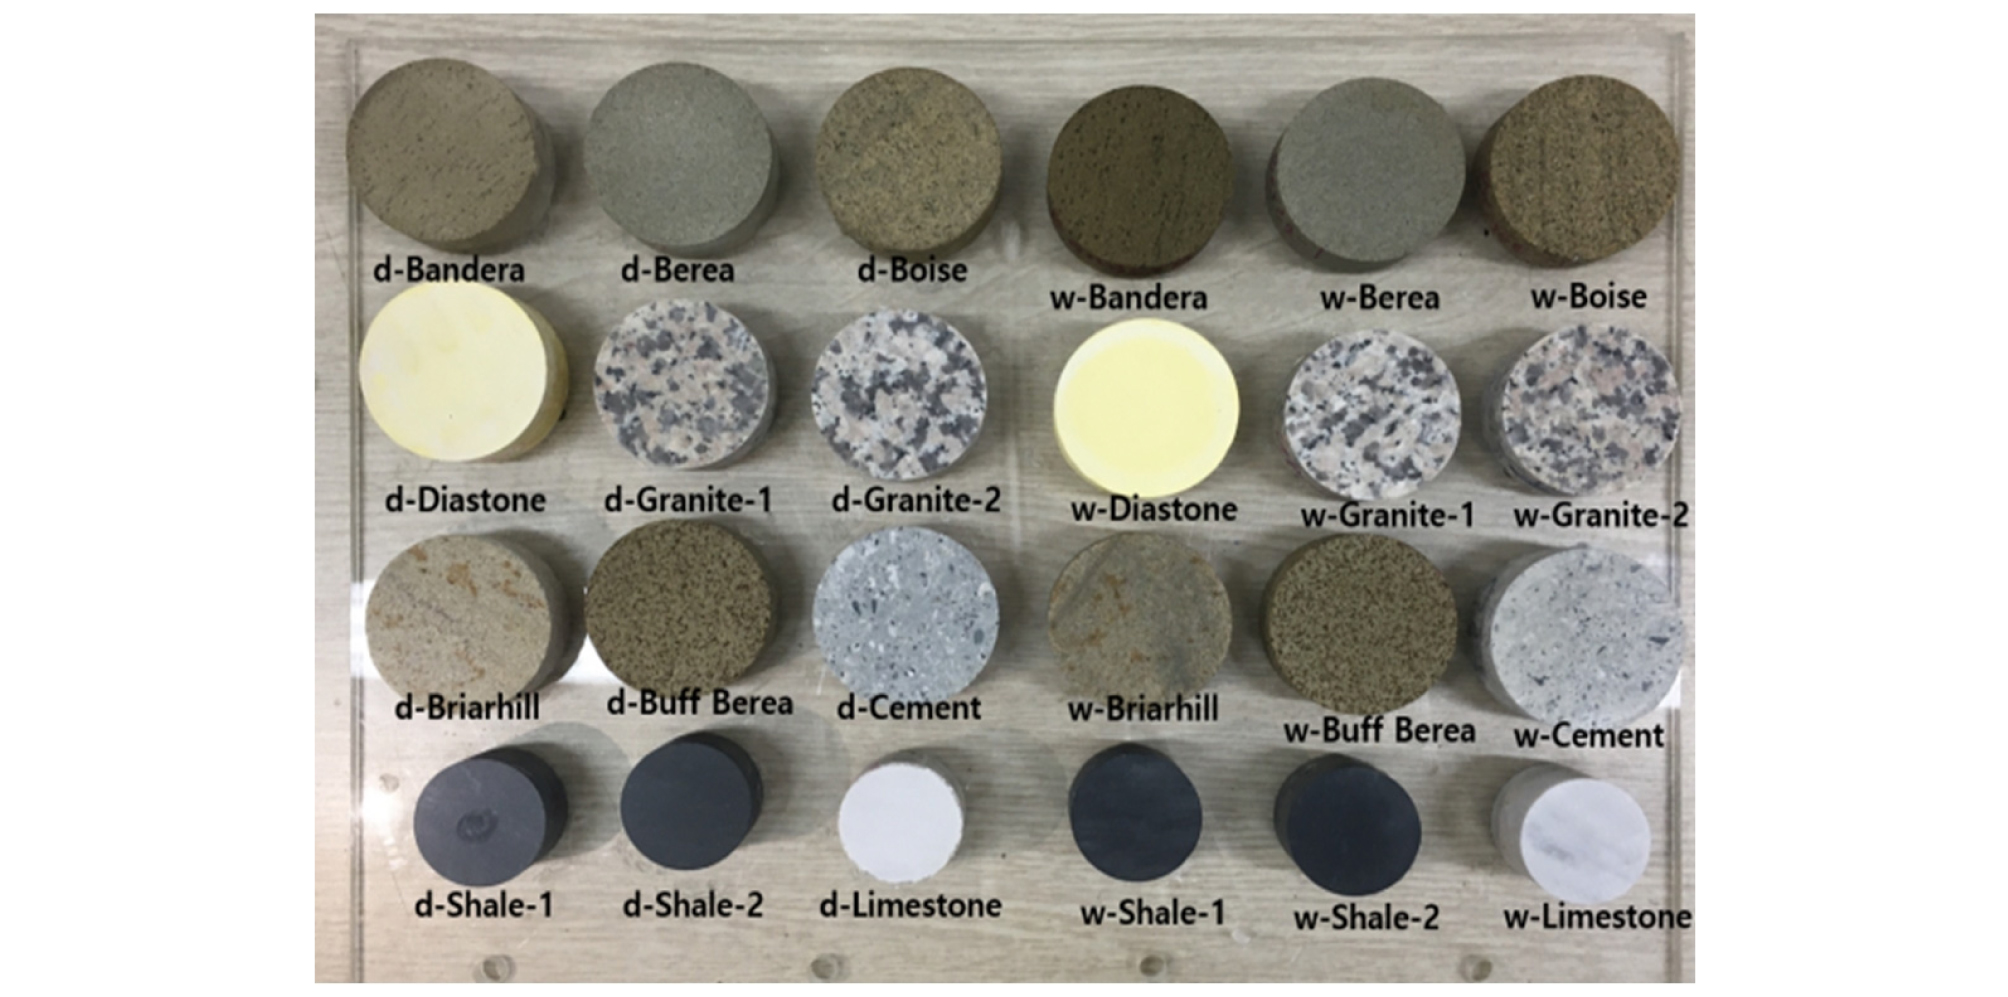
A total of 12 rock or rock-like test specimens were prepared with different properties and colors: five types of sandstone (Bandera, Berea, Buff Berea, Boise, and Briarhill sandstone), two granites, two shales with different anisotropic feature, limestone, cement mortar, and Diastone (a kind of hard gypsum). All of them were shaped as a Brazilian tension disc. The size and mechanical/physical properties of them are presented in Table 1.
Table 1.
Size, mechanical and physical properties of the specimens used in this study
Two sets of the 12 specimens were prepared to investigate the relationship between water saturation or surface water condition and LiDAR intensity. The first group (w-group) was tested after 24 hours of water saturation, while the second group (d-group) was tested after 24 hours of drying. Even in the case of a saturated specimen, water may evaporate from the surface during an experiment, resulting in a decrease in its weight. Thus two more testing conditions were added: sprayed water on the surface of a dry specimen and a saturated specimen just before testing.
Figure 2 presents the 12 dried specimens on the left and the 12 saturated on the right. Shale 1 and Shale 2 showed transversely anisotropic feature of which the angles of anisotropy were 45° and 90°, respectively. Granite 1 and Granite 2 basically had similar physical properties except for the uniaxial compressive strength (UCS).
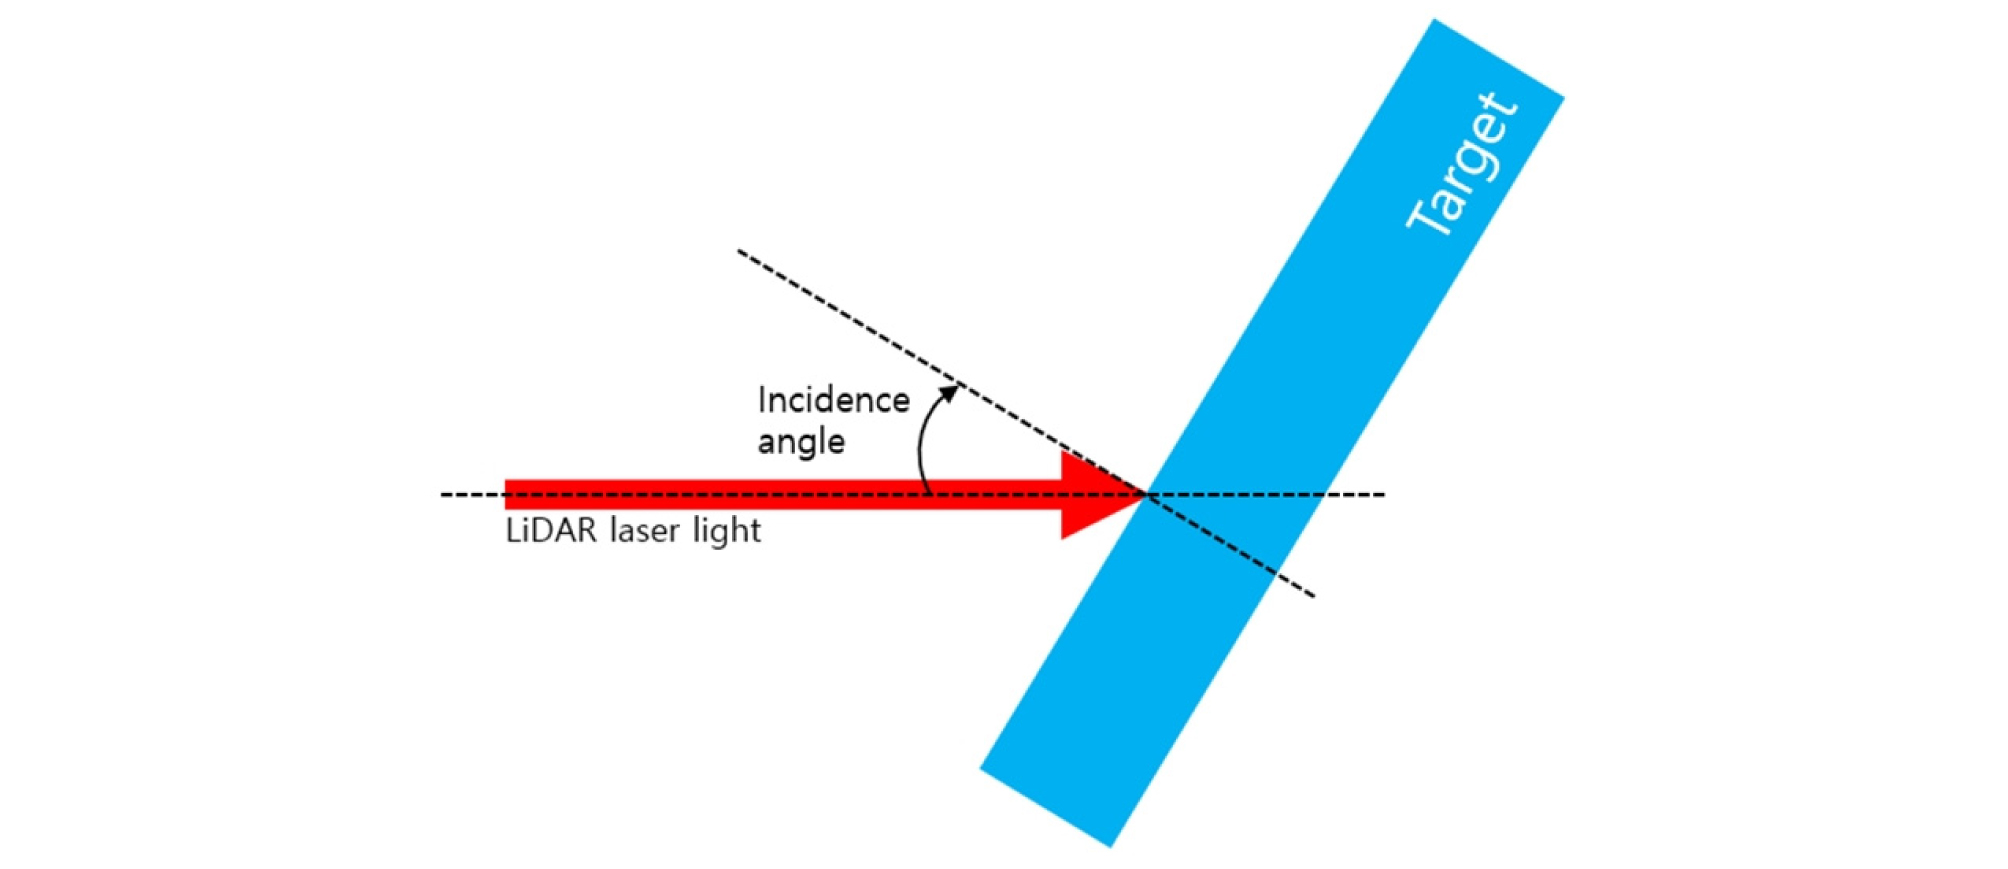
For the same sets of the specimen, experiment was repeated at 5, 10, 15, and 20 m of distance between the specimen and the LiDAR to determine the relationship between the scanning distance and the intensity. To determine the relationship between the incidence angle and the intensity, the specimen plate was tilted from 15° to 90° at 15° interval for each distance. The incidence angle makes 90° with the dip angle of the specimen plate as shown in Figure 3.
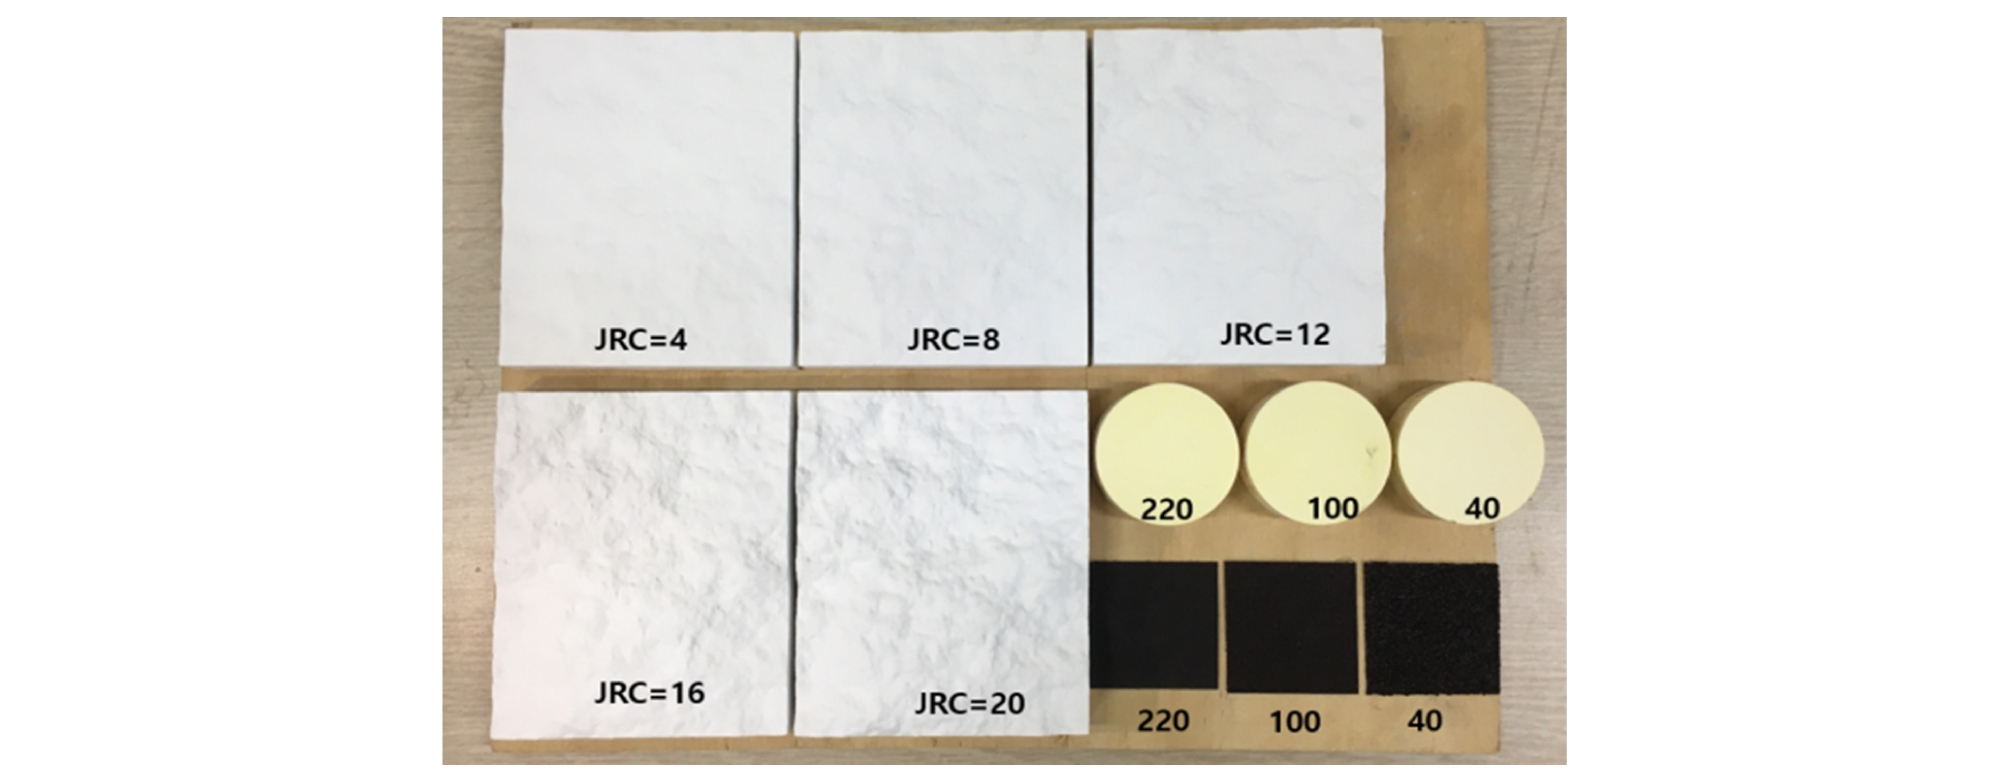
For the relationship between the joint roughness coefficient (JRC) and intensity, specimens with JRCs of 4, 8, 12, 16, and 20 were 3D printed (Lee et al., 2017). Considering that the scanning resolution of LiDAR is high enough, it was tried to test both JRC scale and micro-scale of surface roughness. Five specimens with different JRCs, three sandpapers with grit size of 40, 100, and 220, and three Diastone specimens polished with the sandpaper were placed on the same specimen plate as shown in Figure 4, and the intensity was measured for different distances and incidence angles.
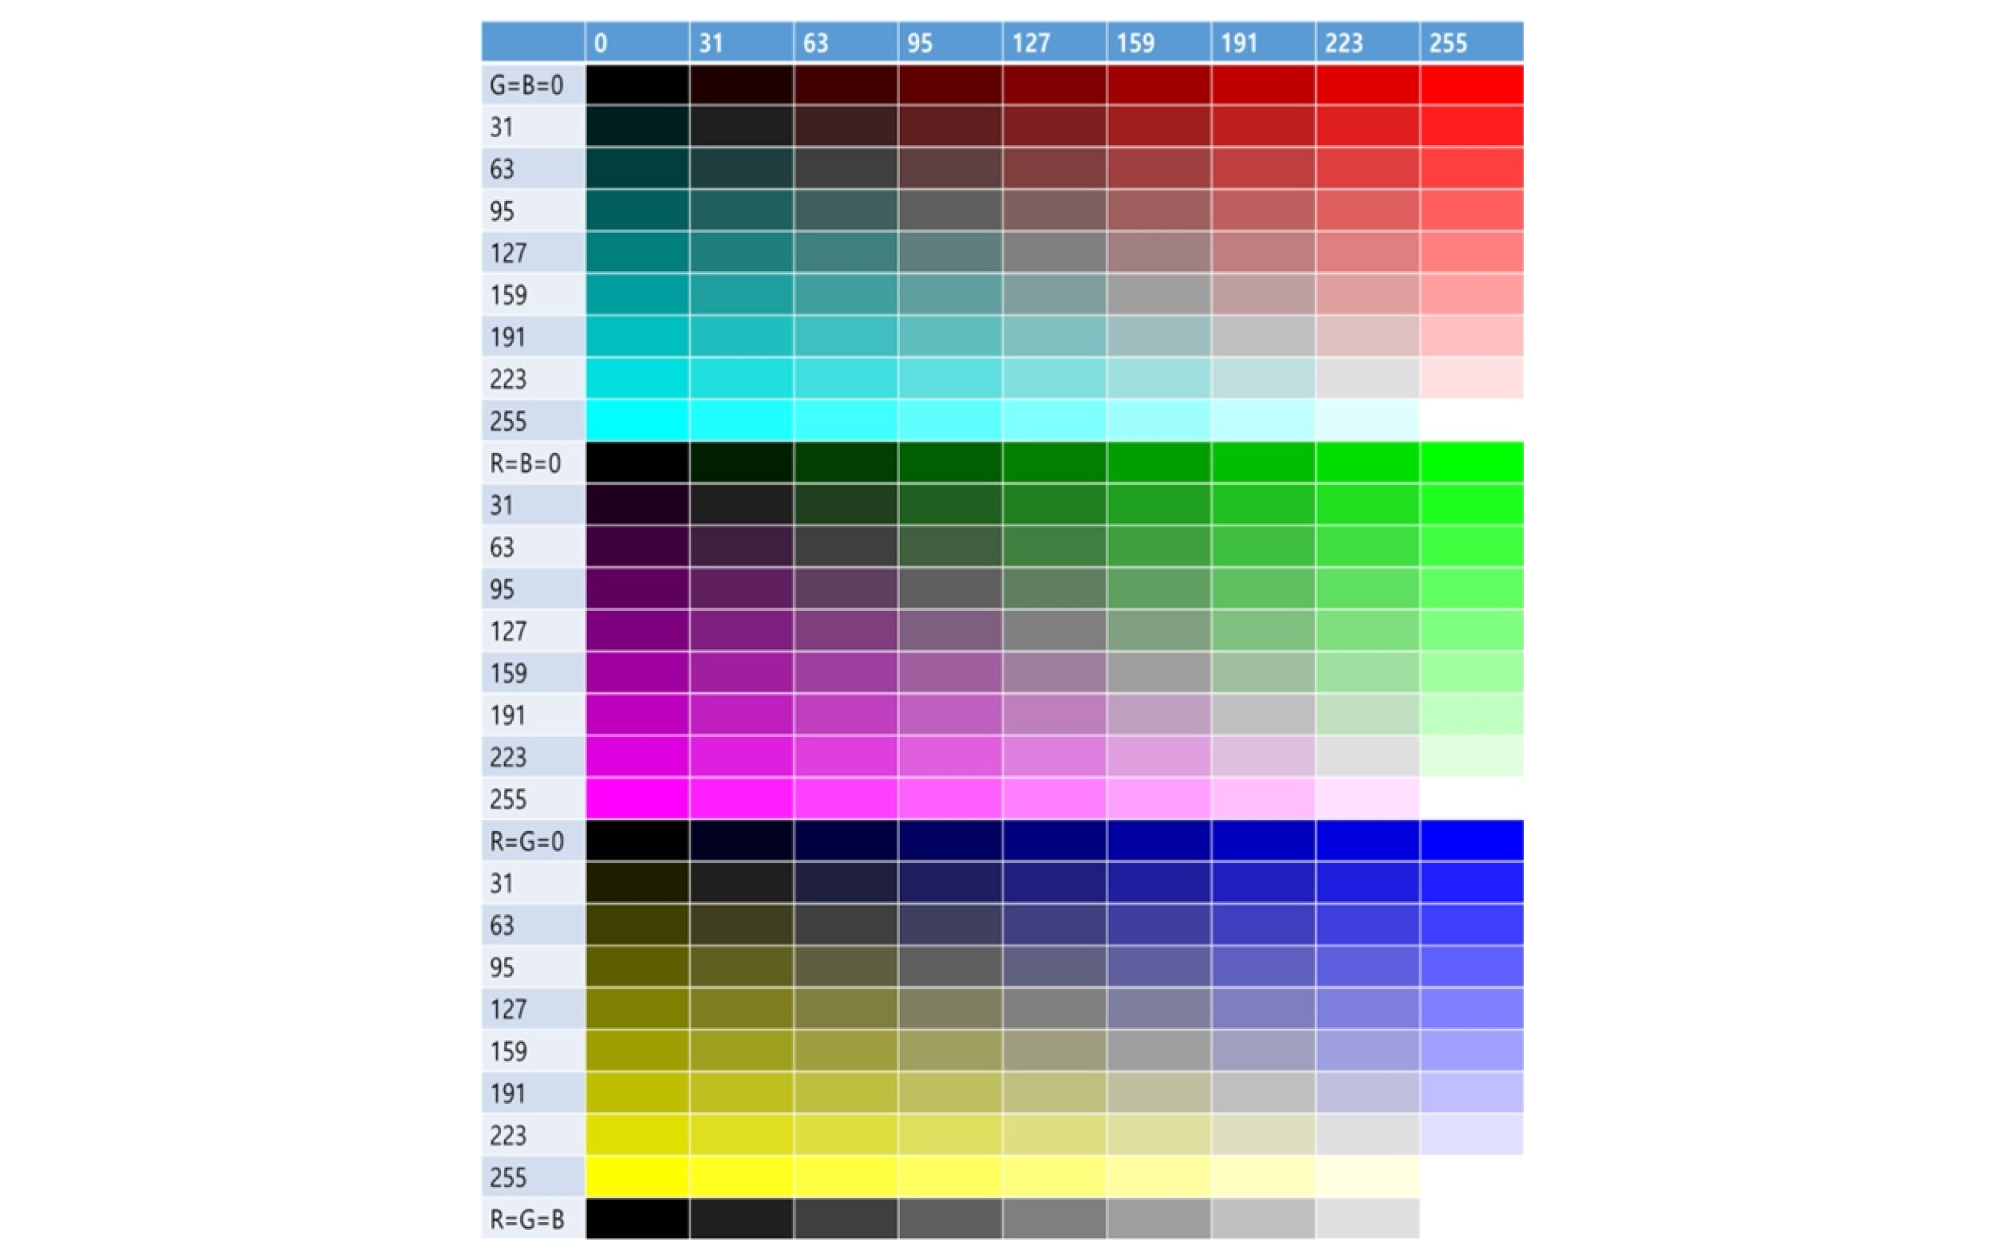
In addition, in this study, a laboratory color test was performed to minimize the effect of sunshine and atmospheric conditions by identifying the characteristics of the RGB values that affect the intensity. The test was performed on a printed color palette table by setting a total of 252 RGB values as shown in Figure 5.
In this study, FARO Laser Scanner Focus S350 was used for the experiment as shown in Figure 6. The specifications of the LiDAR are summarized in Table 2. For post-processing work, FARO SCENE 2018 software was used throughout this study.
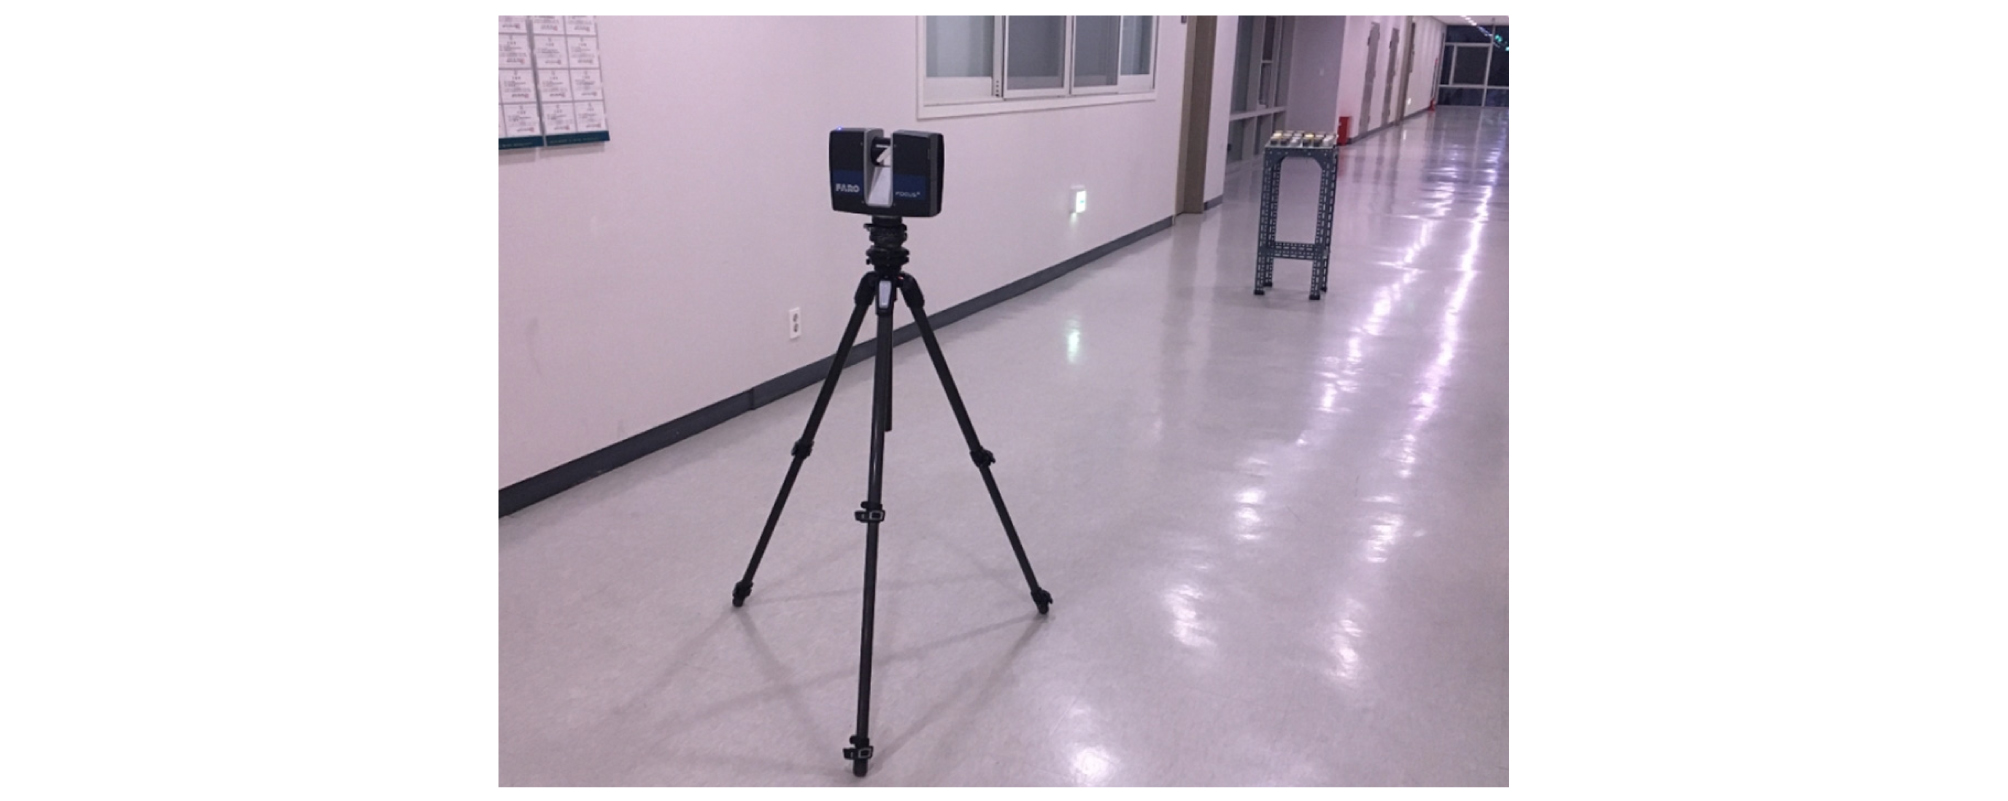
Table 2.
Specifications of FARO Focus S350
3. RELATIONSHIPS BETWEEN LIDAR INTENSITY AND THE PARAMETERS
3.1 Scanning distance
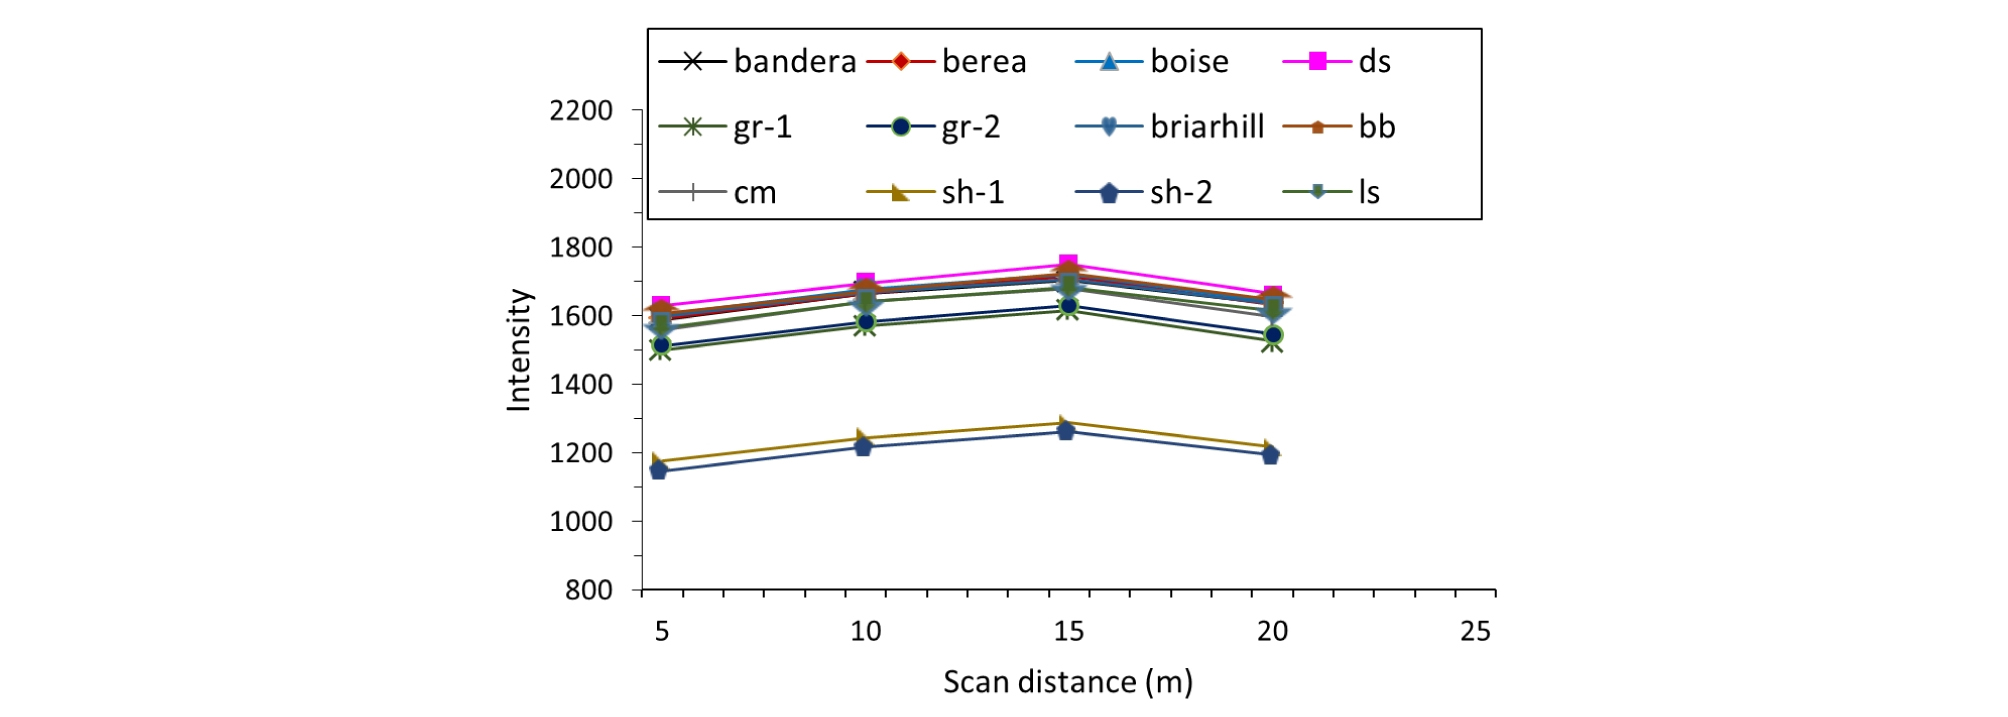
Theoretically, LiDAR intensity is inversely proportional to the square of the scanning distance. However, in the experiment, the intensity tended to increase with the increase at the distance from 5 m to 15 m as shown in Figure 7. Studies by Tan et al. (2015) and Kaasalainen et al. (2011) presented the same tendency that the intensities at very close distance are influenced by the system noise and diffusion of the laser pulse that is always present in near-distance measurement. According to Kaasalainen et al. (2011), this observation resulted from the effects of the unknown amplification of the received optical power or near-distance reducers.
Thus, it was found that the inversely proportional relation was valid only for the distance greater than 15 m in this study. For the distance less than 15 m, the intensity can be directly corrected considering the relations shown in Figure 7. The optimal distance for LiDAR scan could be suggested to be 15 m from the results of this study.
3.2 Incidence angle
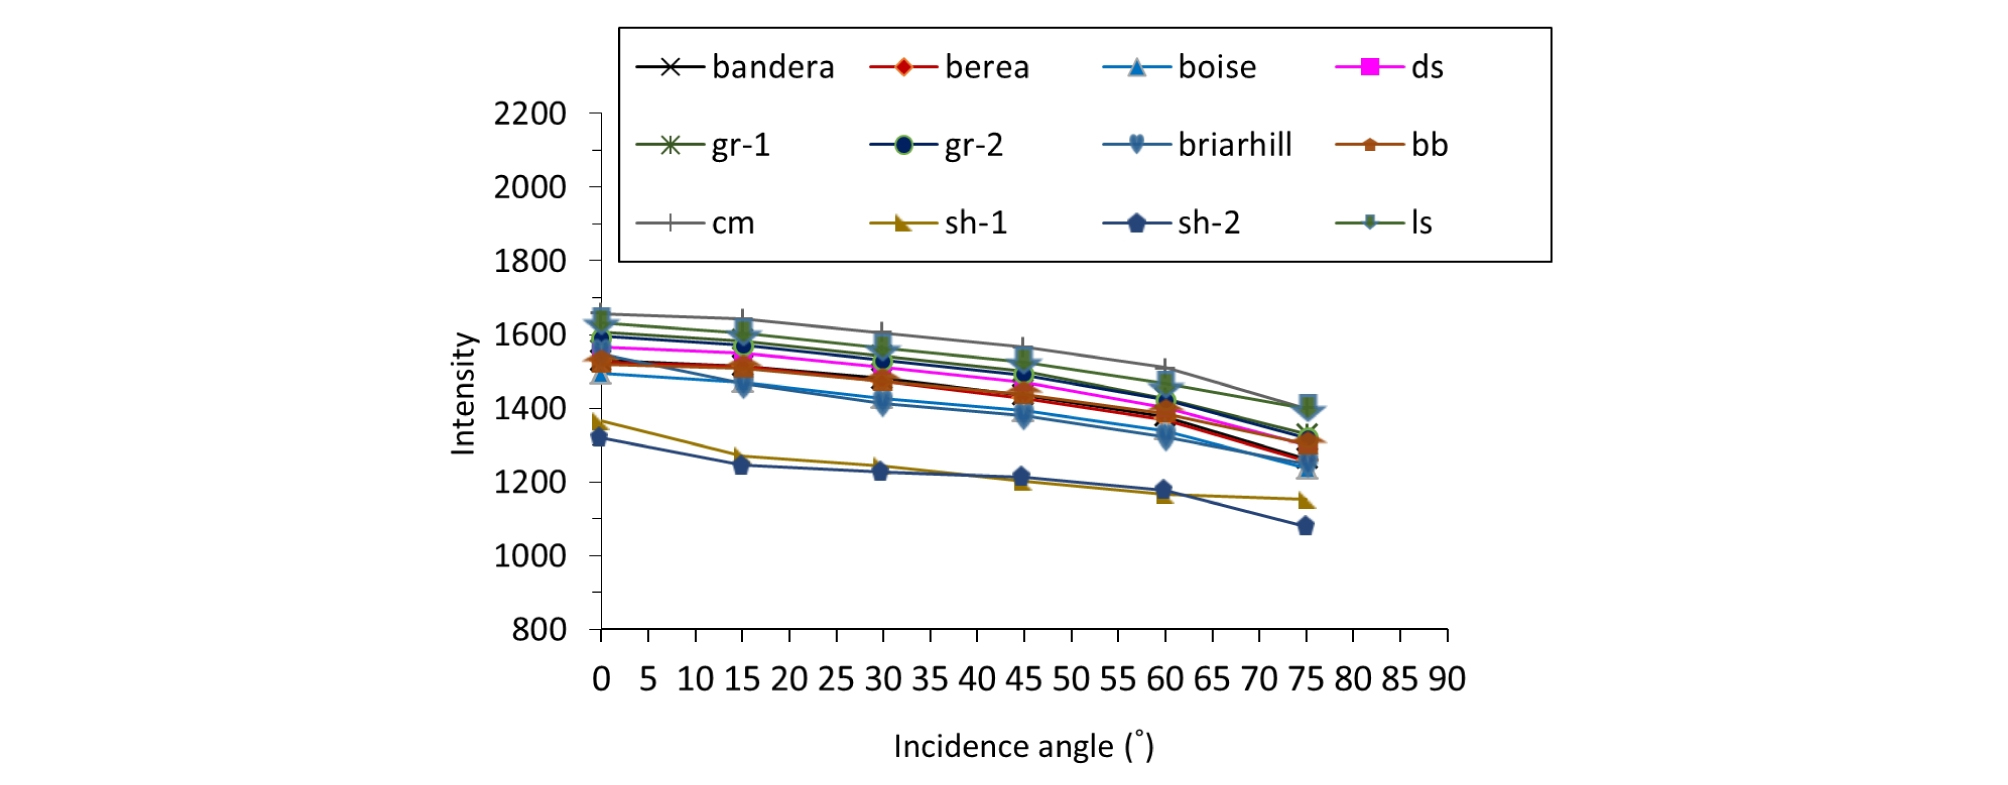
As for the incidence angle, the intensity has the maximum value at the incidence angle of 0° as expected. As incidence angle increased from 0° to 75°, the intensity linearly decreased. The difference in the intensity at 0° and 75° was about 250. Considering that the full range of intensity of FARO S350 was 0 – 2047 as presented in Table 2, the difference in the intensity by the change of incidence angle could take up as much as 12%, which is considered significant. Figure 8 shows the relationship between incidence angle and LiDAR intensity.
3.3 Surface roughness
Surface roughness had a mere impact on LiDAR intensity. Micro-roughness was also considered to be one of the potential factors that could affect the intensity. However, considering that there was almost no change in most cases and the maximum difference in intensity of approximately 50 in the case of an incidence angle of 75, it can be concluded that the effect of micro-roughness on intensity was negligible.
However, in real rock mass, surface roughness may change incidence angle which can make difference in intensity as a result.
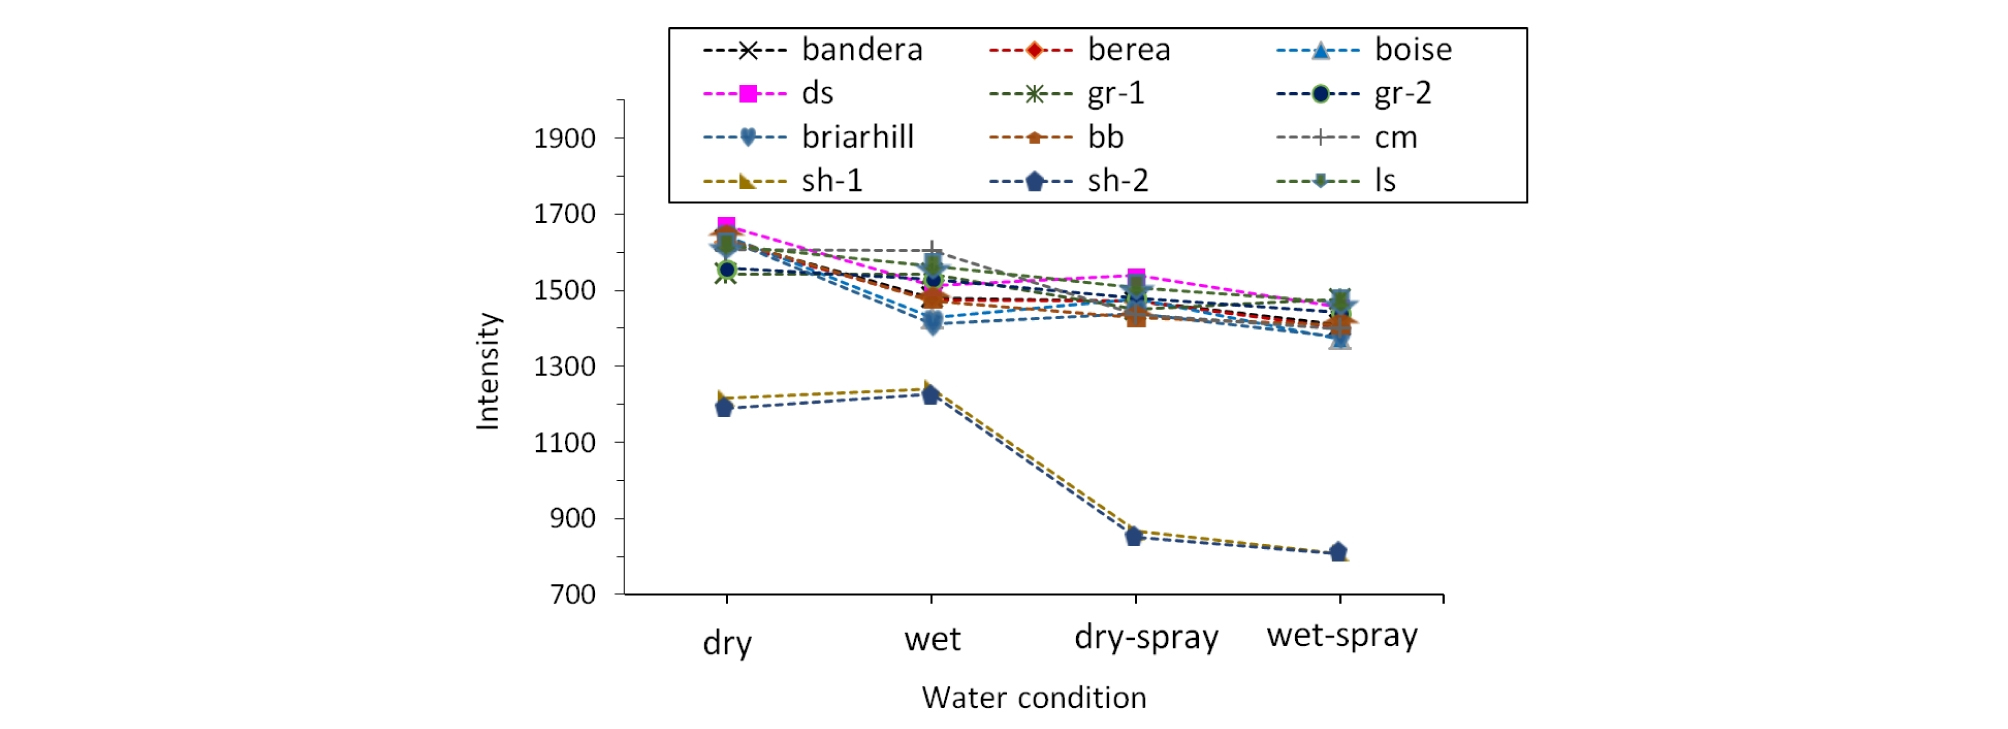
3.4 Water condition
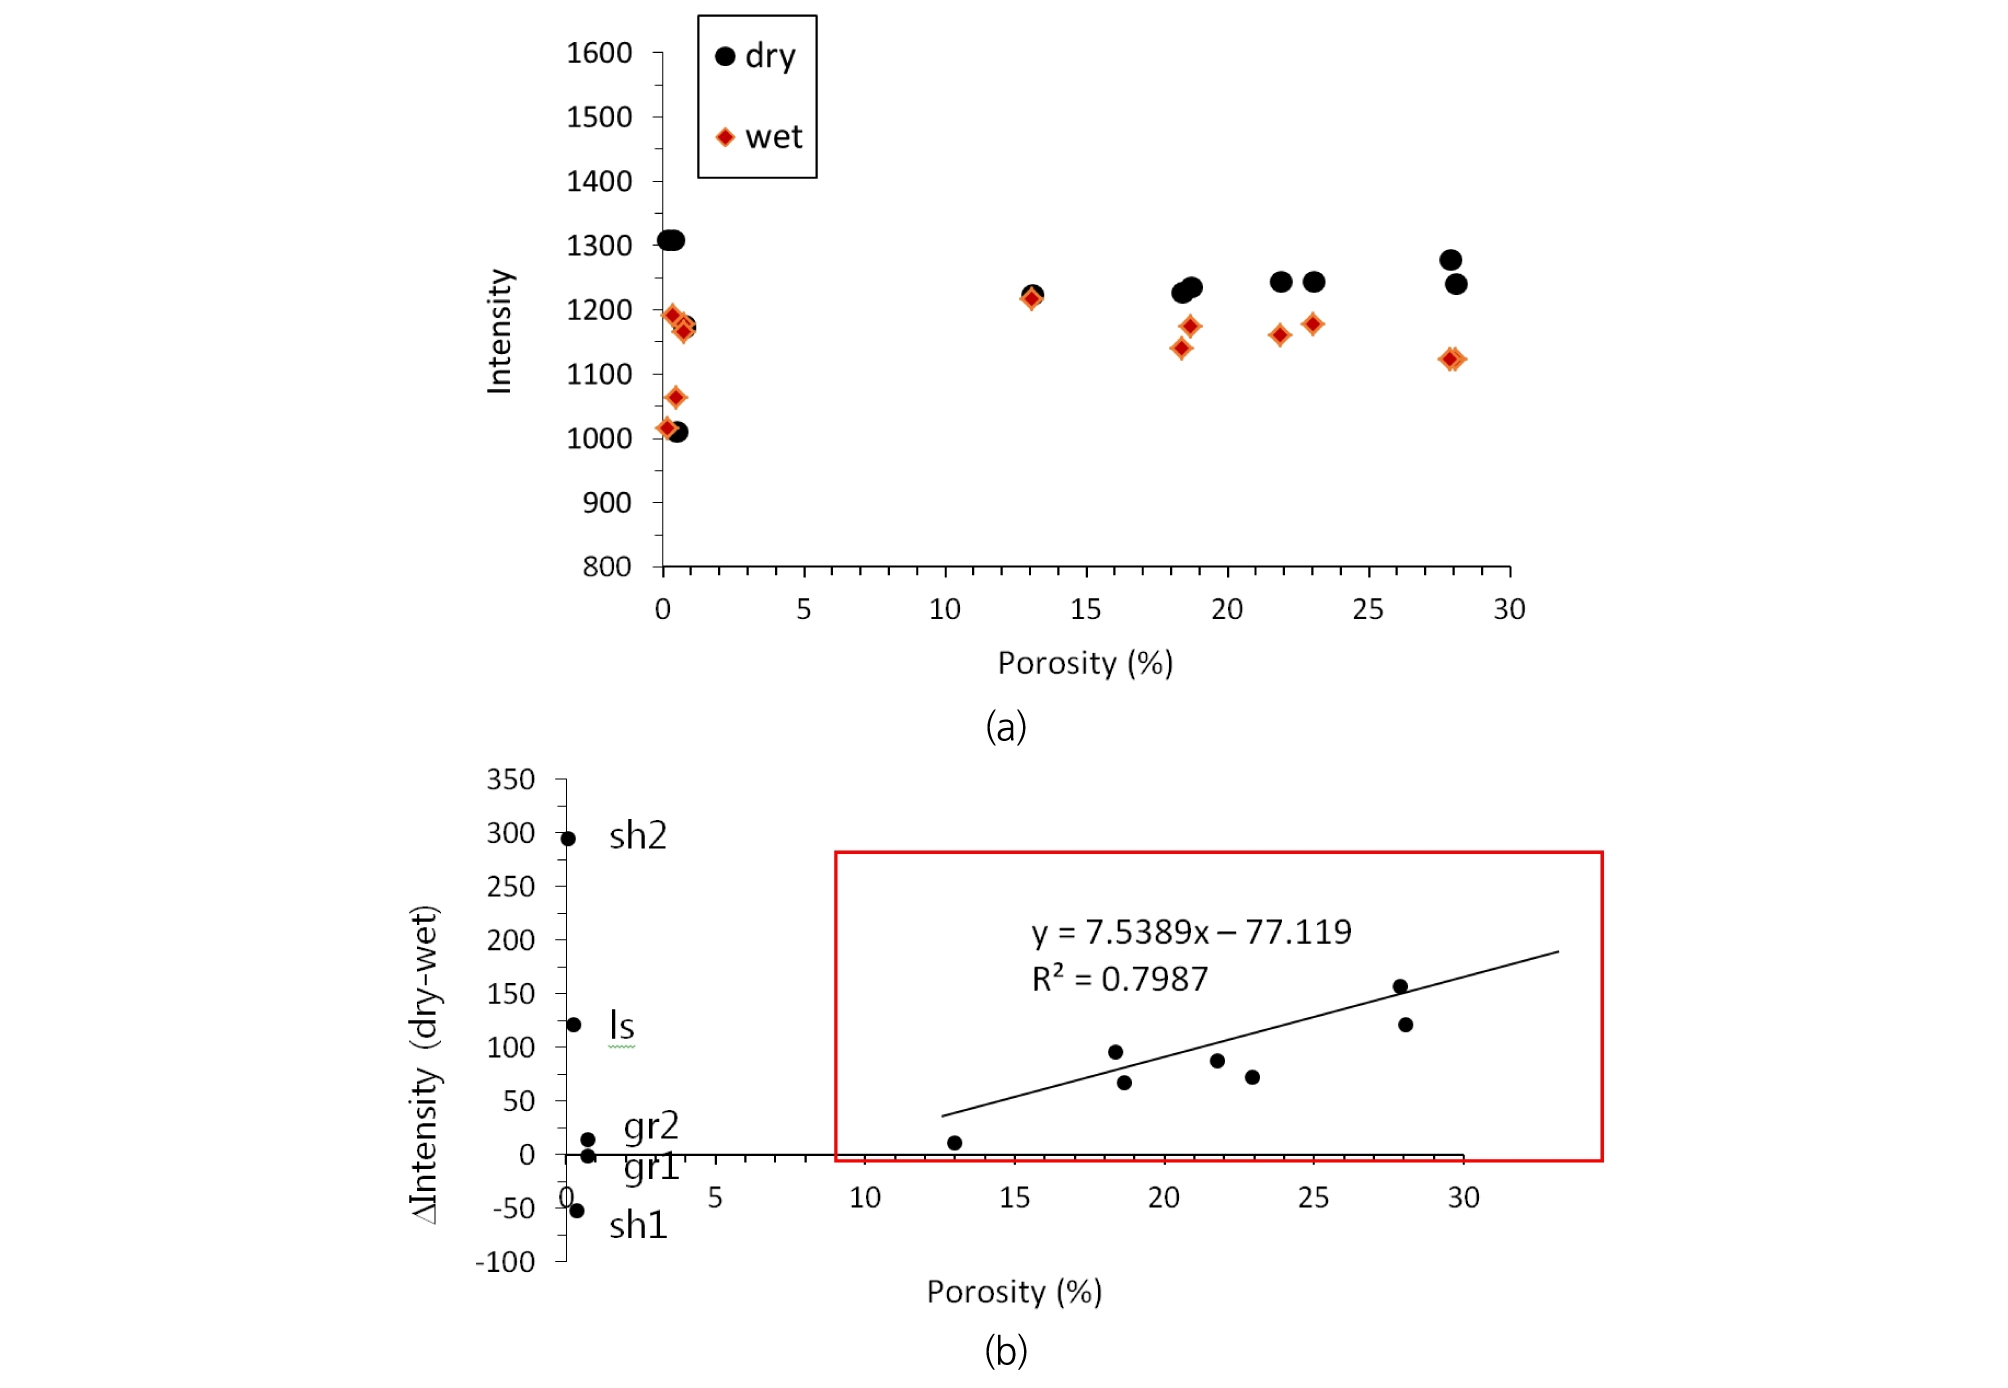
Saturation level affected LiDAR intensity. The specimens with high porosity, such as Diastone (27.9%) or sandstone (18.4 – 28.1%), showed large differences in intensity between the dried and saturated specimen as presented in Figure 9. When the specimens had high porosity, the intensity seemed to be determined by the degree of saturation rather than the surface characteristics of wetness. In contrast, in the case of shale or granite, the difference in intensity between the dried and the saturated specimen was not significant, while the difference was remarkable between water-sprayed case and non-sprayed case. This shows that, in the case of specimens with low porosity, the intensity was rather affected by the surface wetness than the degree of water saturation.
Franceschi et al. (2009) suggested a quantitative relationship between water content and LiDAR intensity. Two types of rock were tested in their study: marl and limestone. In general, as the water content increased by 1%, the intensity decreased by 10% except for a few outliers. The porosity of limestone was around 10% and that of marl was 55%.
3.5 Physical and mechanical properties
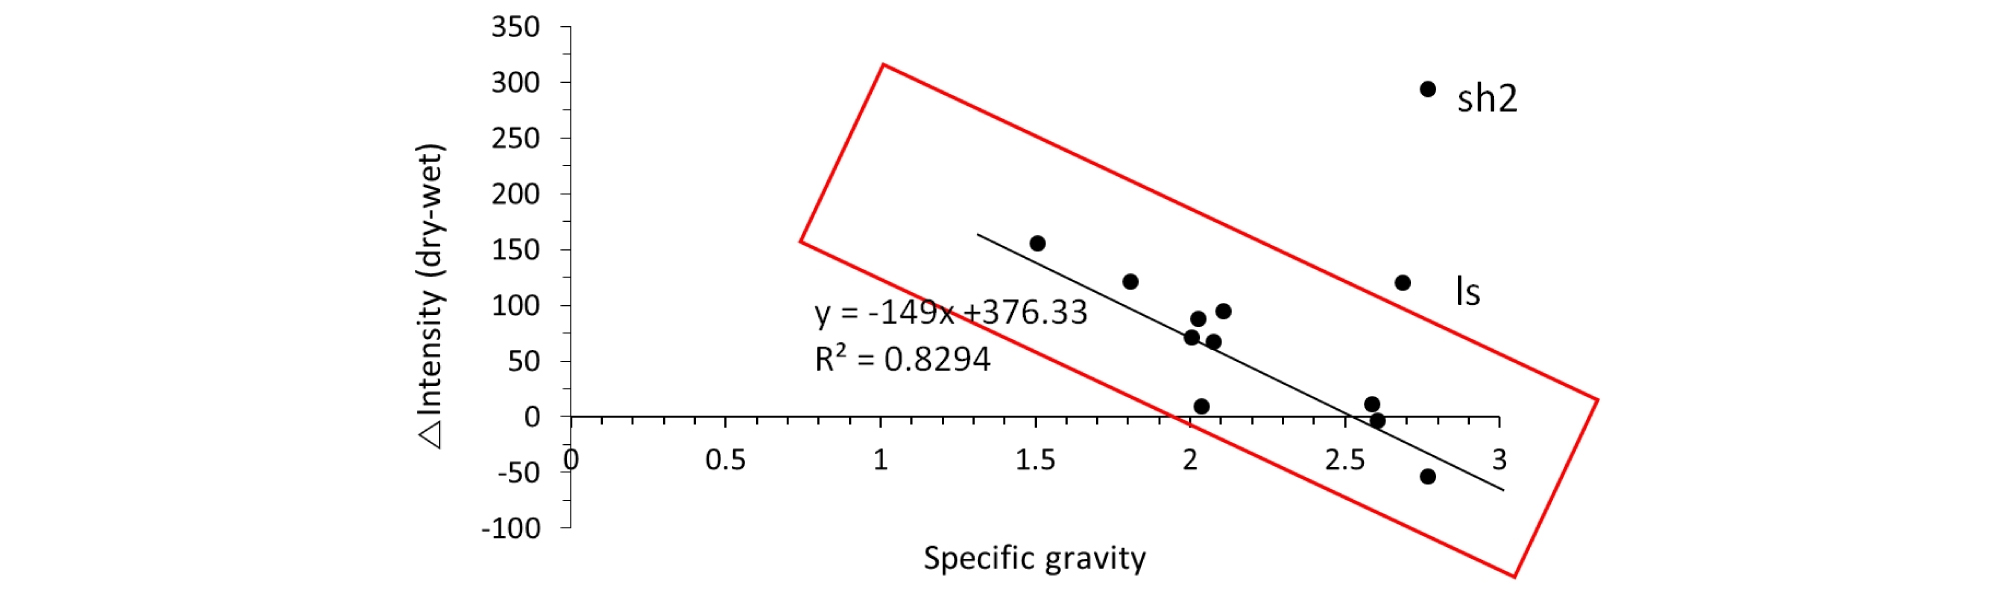
It was observed that porosity and intensity difference in wet and dry condition had a linear relationship as shown in Figure 10. On the while, specific gravity and intensity difference had an inversely proportional relationship as in Figure 11. However, for the specimens with low porosity like shale, granite or limestone, the relationship was not obvious.
The relationships between the intensity and UCS, p-wave velocity, and s-wave velocity were determined to be Equation (1), (2), and (3), respectively.
| $$y=959.72\times e^{0.0015x}$$ | (2) |
| $$y=836.68\times e^{0.1192x}$$ | (3) |
| $$y=879.09\times e^{0.0553x}$$ | (4) |
where, y is the intensity and x is the affecting parameters.
3.6 Mineral composition
It is known that mineral composition of rock affects the LiDAR intensity (Burton et al., 2011). The reflectance of a granular surface is complexly controlled by the composition of the individual grain, their weight fraction, and grain size. When the photons emitted from the LiDAR laser source encounter the granular surface of an outcrop, some are absorbed while others are scattered. Bright grains (e.g., quartz) scatter the most photons, while dark surfaces (e.g., coal) absorb the majority of the photons. Thus sandstone containing a high percentage of quartz should be more reflective than shale.
A dense rock with very low porosity, such as granite, displayed the effect of the color (RGB value) of the surface on intensity very well. RGB value was converted to grayscale level according to the method of NTSC (National Television System Committee). The grayscale level was converted from R, G, and B color values with the weights of 0.299, 0.587, and 0.114, respectively, and then added to obtain a grayscale level. It has been determined that the human eye is the most sensitive to first green, then red, and then blue.
The Pearson correlation coefficient between the grayscale level and intensity of 0.843 was obtained in the case of granite. However, in the case of Bandera sandstone, of which the porosity was 23.06%, the Pearson correlation coefficient was only 0.307. Relationship between grayscale level and intensity is clearer in low porosity specimen.
It can be seen from Figure 12 that the correlation between the grayscale level and intensity was high for granite. The intensity increased at high grayscale level and decreased at low grayscale level. The mineral contents of the granite were quartz, albite, microcline, and biotite (Wicaksana, 2020). From the picture at the bottom of Figure 12, easy match can be made among the intensity, grayscale, and mineral content: high intensity and high grayscale (whiter) for quartz and albite; low intensity and low grayscale (blacker) for biotite; in the middle for microcline.
It was reasonably assumed that if the mineral composition of a rock is known, the overall intensity could be estimated by taking a weighted average of the intensity of each mineral. The analyzed mineral composition of the granite used in the test and the weighted average of LiDAR intensity are presented in Table 3. The averaged LiDAR intensity obtained by weighted average was 1632. But, the LiDAR intensity of the whole area of the granite specimen was represented by 1612. The difference seemed to come from other mineral components that were not considered in weight averaging process.
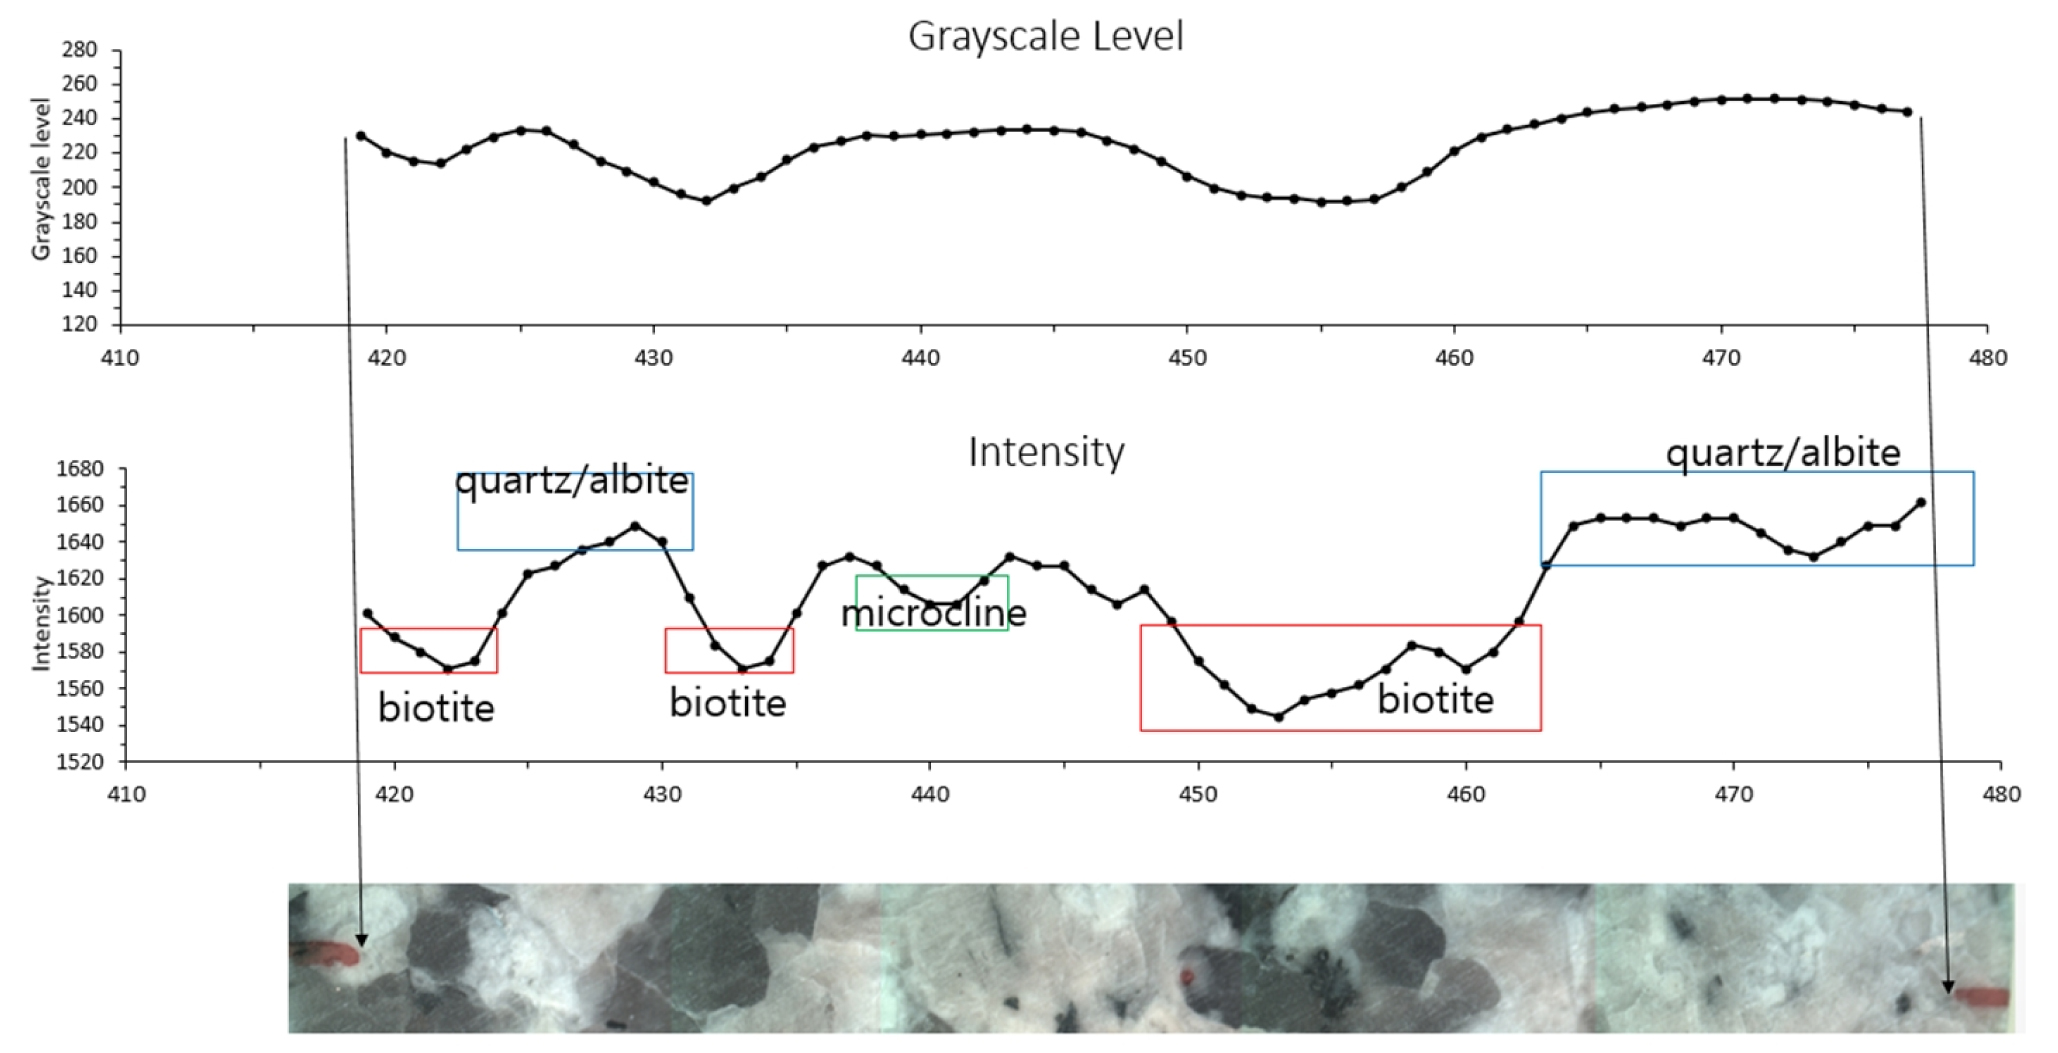
Table 3.
Weight-averaged LiDAR intensity from mineral composition of the granite used in this study
| Mineral composition | Weight percent (%) | Averaged LiDAR intensity |
| Quartz / Albite | 35.4 / 34.9 | 1647 |
| Microcline | 20.8 | 1608 |
| Biotite | 8.9 | 1565 |
| Others | Not considered | - |
| Sum / Weight-average | 100 | 1632 |
3.7 Color information
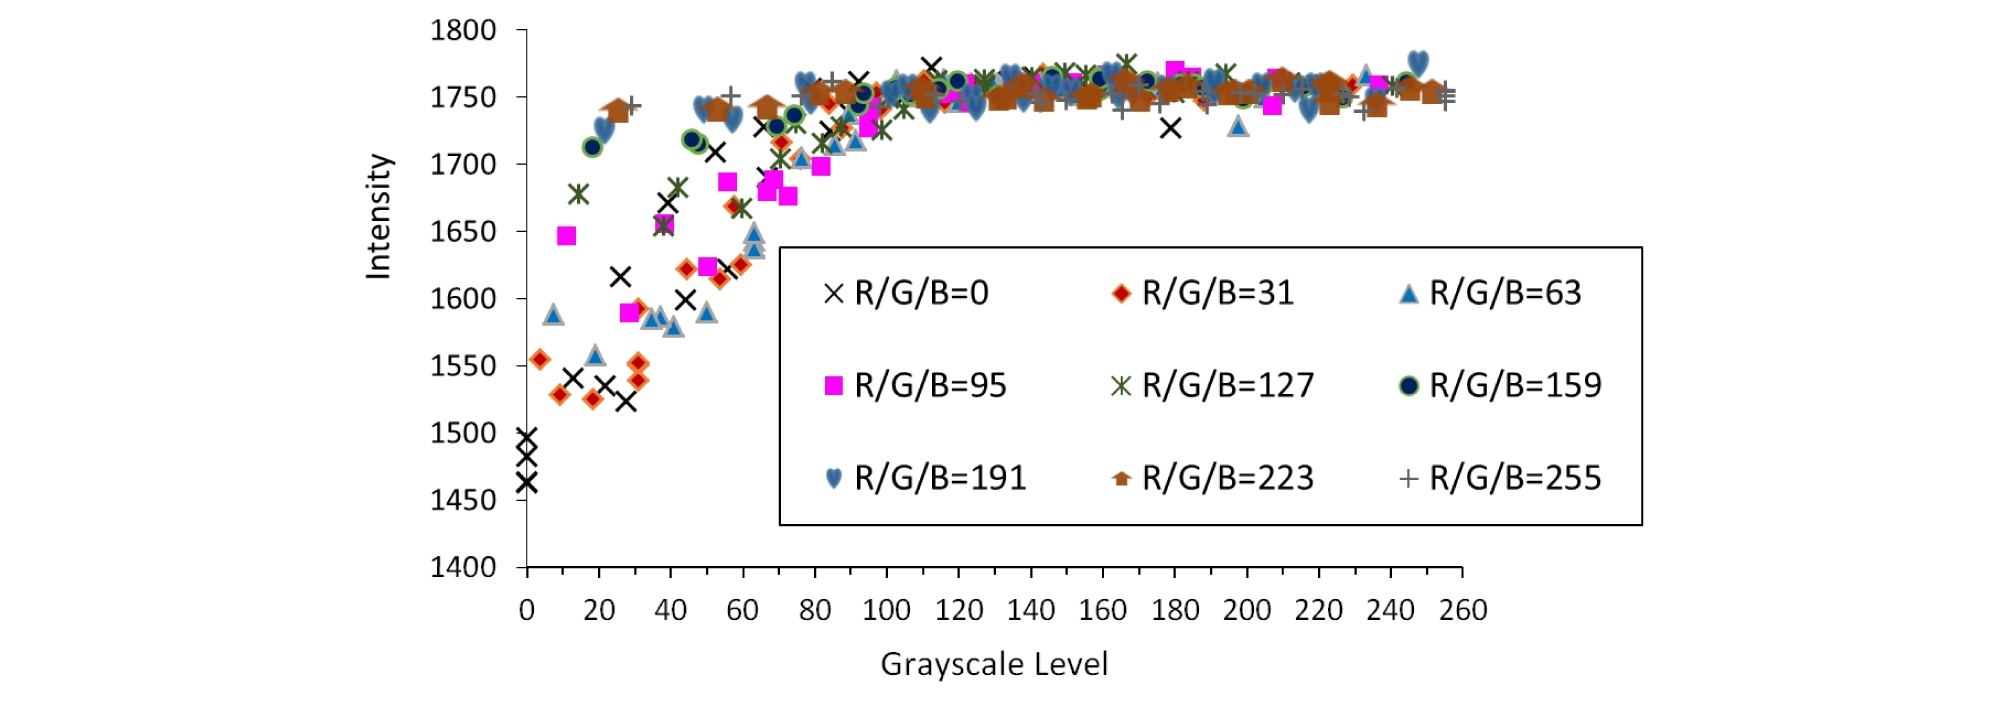
After scanning the RGB color palette table in Figure 5 and comparing the intensity of each RGB value (after converted to grayscale level), Figure 13 was obtained. With the increase of grayscale level, the intensity increased. Each shape in the graph represents different R, G, or B value. Brighter color represented the tendency better.
In Figure 13, it is obvious that there is a clear relationship between the intensity and grayscale level. To obtain the optimal relationship, Kolmogorov-Smirnov (KS) test was performed. As a result, it was found that an exponential function could best fit the measured intensities. The relationship is presented in Equation (5), where y is the intensity and x is the grayscale level.
| $$y=1763.72-265.66\times e^{{}^-0.0225x}$$ | (5) |
However, as can be seen in Figure 13, the relationship between the grayscale level and intensity is more apparent at the grayscale level range between 0 and 100. Therefore, it was appropriate to use Equation (6) after mapping all the grayscale level to the specific range between 0 and 100.
| $$y=1840.33-323.05\times e^{{}^-0.0125x}$$ | (6) |
3.8 Summary
Each parameter differed in terms of the amount of importance it had in affecting LiDAR intensity. To summarize this, Table 4 illustrates the degree to which each parameter influenced intensity.
The RGB value converted to the grayscale level had the most influence, followed by the incidence angle, and distance. The intensity will also vary depending upon the material. For example, fresh snow gives a very high intensity reading, while dark soil is very low. However, since all the samples used in the experiment were rocks, they did not exhibit intensity across the entire range from 0 to 2047. The laboratory experiment results showed that the intensity was distributed between approximately 700 and 1700. The influence of each parameter within the interval was as shown in Table 4. The maximum and minimum values used are the averaged values.
4. CONCLUSIONS
In this study, a series of laboratory test were performed to investigate the characteristics of LiDAR intensity. Twelve rock and rock-like specimens were selected to represent different rock types, mechanical and physical properties. Five different sandstones (Bandera, Berea, Boise, Briarhill, and Buff Berea), two granites, two shales, a limestone, cement mortar, and Diastone were used. For the LiDAR unit, FARO Focus S350 was used of which the full range of intensity was between 0 and 2027.
Previous studies have shown that LiDAR intensity is affected by mineral composition of rock, strength, and the degree of weathering. In this study, the relationships between LiDAR intensity and various affecting parameters were analyzed including scanning distance, incidence angle, surface roughness, water condition, mechanical and physical properties, mineral composition, and color information. For the specimens used in this study, the parameters that influenced the LiDAR intensity were, in the order of importance, color information in RGB (29.4%), incidence angle (23.6%), scanning distance (16.5%), mechanical/physical properties (13.4%), and water condition (12.5%). Surface roughness affected the intensity but it was negligible with less than 5% of contribution. The LiDAR intensity of the specimens measured from 700 to 1700, which took roughly 50% of the full range of the intensity by FARO S350. It implies that the intensity value can be effectively used to identify the affecting parameters which are involved in rock mass characterization.
When converting RGB color information to grayscale, it was highly related to intensity. The relationship is as shown in Equation (6). As incidence angle increased from 0° to 75°, the intensity linearly decreased. The difference in the intensity at 0° and 75° was about 250. The square of the scanning distance was not always inversely proportional to the intensity, and it is recommended to be used when the scanning distance is greater than 15 m. Relationships between intensity and physical/mechanical properties of rock specimen are shown in Equation (2), (3), (4), Figure 10, and Figure 11. Effect of water condition to intensity is shown in Figure 9. Roughness does not seem to be highly relative with intensity. Mineral composition was relative to grayscale level that finally affected intensity.
LiDAR intensity is affected by various parameters. Then, the measured intensity after the process of correction for each and every affecting parameter shall represent the state of weathering or alteration of the target point. In such way, the LiDAR point cloud of the corrected intensity can be ultimately used in the process of determining the rock mass classification for the target surface of rock mass. This study provides primitive results of characterizing LiDAR intensity for an engineering purpose, especially rock engineering. Accumulated knowledge and case studies will help improve the applicability of LiDAR intensity.
