

1. Introduction
2. Theoretical Background
3. Joint Survey System
3.1 Composition and Principle of system
3.2 Arduino Uno
3.3 9 Axes Motion Sensor
3.4 Ultrasonic Sensor
3.5 XBee Sensor
3.6 Software of data acquired
3.7 Servo Motor
3.8 Unmaned Aerial Vehicle
3.9 ESP 8266
3.10 Blynk
4. Test Result
4.1 Result of Joint Data
4.2 Reliability Analysis of Data
4.3 Analysis of Error Cause
4.4 Analysis Result of the stereographic projection method
5. Conclusions
1. Introduction
In general, rock analysis exposed to the surface is classified as a stable analysis considering the joint orientation and the mechanical characteristics. This is because the stability of the rock is associated with the orientation of the joint and its mechanical properties.
The characteristics of the rock joint structure are derived from the analysis of the joint surface and the statistical analysis after making contact with the joint surface, such as the survey of the scanline, the investigation of the window, and the investigation by the clinometer (Son et al., 2014).
Currently, the use of long-distance survey techniques using photogrammetry techniques and laser scanner methods is increasing, but this is due to the lack of efficiency in analysis of joint structures in large rock and the subjective opinions of the inspector (Moffitt and Mikhail, 1980).
To solve these problems, this study attempted to develop a device for measuring the field joint orientation for the analysis of joint slope. The shrink-level measurement device is divided into hardware and analytic software. The hardware was configured with drones, arduino uno, servo motor, joint orientation measuring module, and wireless transmission module of measurement data to measure the direction of joint structures. The software has been developed to analyze the orientation of joint by printing the data obtained from the measuring module on-screen, and it is called Drone Joint Survey.
The purpose of this study is to develop a device to measure the joint orientation, a mechanical feature of the rock, and to measure the joint orientation module, in order to safely and effectively interpret the rock slope through compare with the existing clinometer.
2. Theoretical Background
For the purpose of evaluating the mechanical stability, the measurements are made on the discontinuous surfaces, such as the joint, and the consequences are likely to be the potential failure aspects of the slope based on the properties of these discontinuous surfaces (Lee, 2016).
The dip angle and dip direction, especially on the discontinuous surface, are the major factors that determine the type of failure upon the collapse of the slope.
A compass clinometer is used to measure the joint surface. (compass clinometer, geological compass, clino-compass, inclinometer with compass etc.). Since the direction of the slope on the clinometer must be measured in a horizontal plane, it is necessary to adjust the equipment horizontally while the joint surface is closely attached to it. Measure the angle after the instructions for compass are stabilized.


Fig. 1 shows a schematic diagram of the joint orientation measurement of rock slope using drones. At point C, hovering drones to measure the value of the horizontal distance a to the rock slope through the ultrasonic sensors and rotate the measured angle, 30° A, in a clockwise direction from the horizontal plane using the servo motor.
Determine the distance value of c that connects the two points on the slope (A, B) and the second point (A) by forming a triangle with each other and using the following expression.
Determine the value of the angle of inclination (θ) by using the triangle’s second cosine law in Fig. 2.
 (1)
(1)
The slope direction of the slope of rock slope joint is calculated from the angle of euler. The rotation order is ZYX (Roll-Pitch-Yaw). Calculate the rotation results of the target coordinate system against the reference coordinate system as follows.
First, rotate the reference coordinate system about the X-axis (Yaw rate) : Rx(Φ)
Second, rotate the reference coordinate system about the Y axis (pitch) : Ry(θ)
Third, rotate the reference coordinate system about the Z axis (Roll). : Rz(ψ)
 (2)
(2)
 (3)
(3)
 (4)
(4)
 (5)
(5)
It is possible to calculate the euler angle from the rotation matrix R as follows. The elements in row i and column j of matrix R are used in the following expression.
 (6)
(6)
When θ is (-π/2, π/2):
 (7)
(7)
When θ is (π/2, 3π/2):
 (8)
(8)
When the pitch angle is near π/2, the cosθ≈0. Calculate it as follows.
 (9)
(9)
 (10)
(10)
3. Joint Survey System
3.1 Composition and Principle of system
In this study, data acquisition and analysis was performed using sketch developed by SmartProjects company. The system consists of Arduino Uno, Sensor modules, Xbee modules, and Blynk. Fig. 3 shows the schematic diagram of the joint survey system.
3.2 Arduino Uno
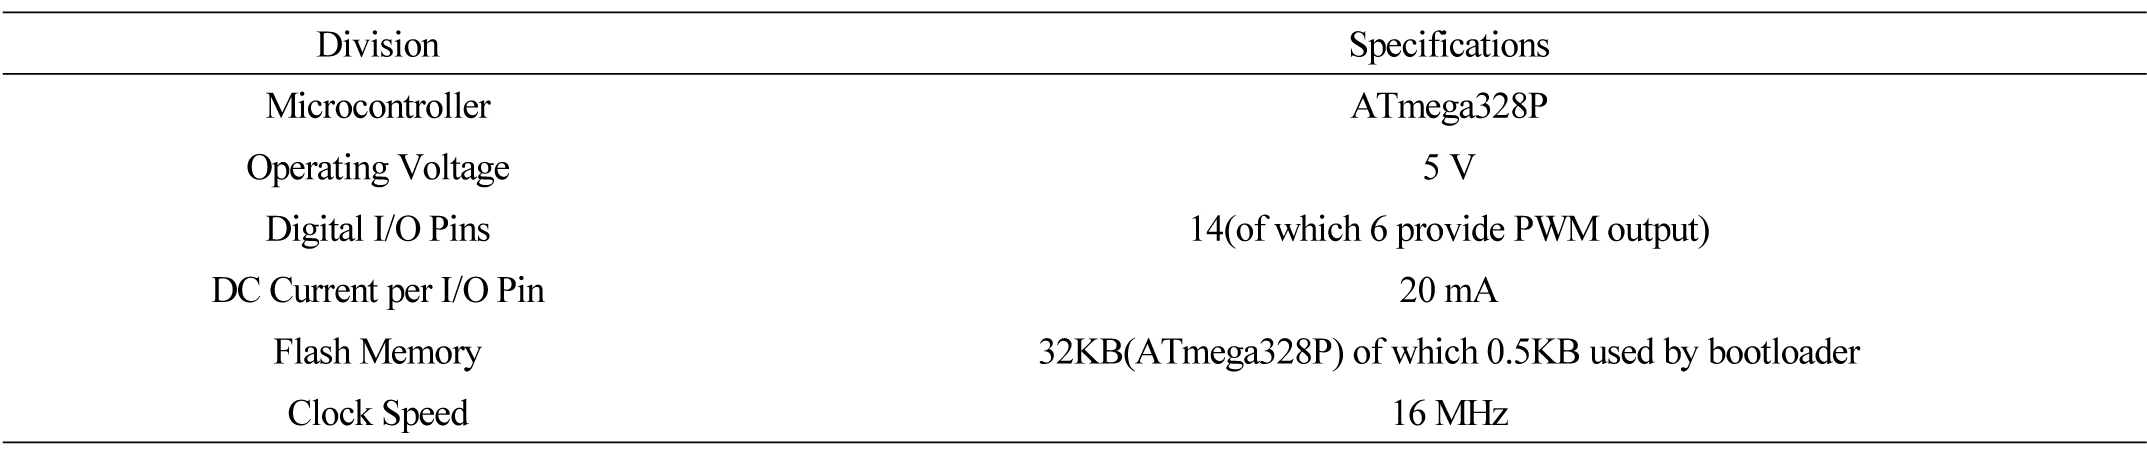
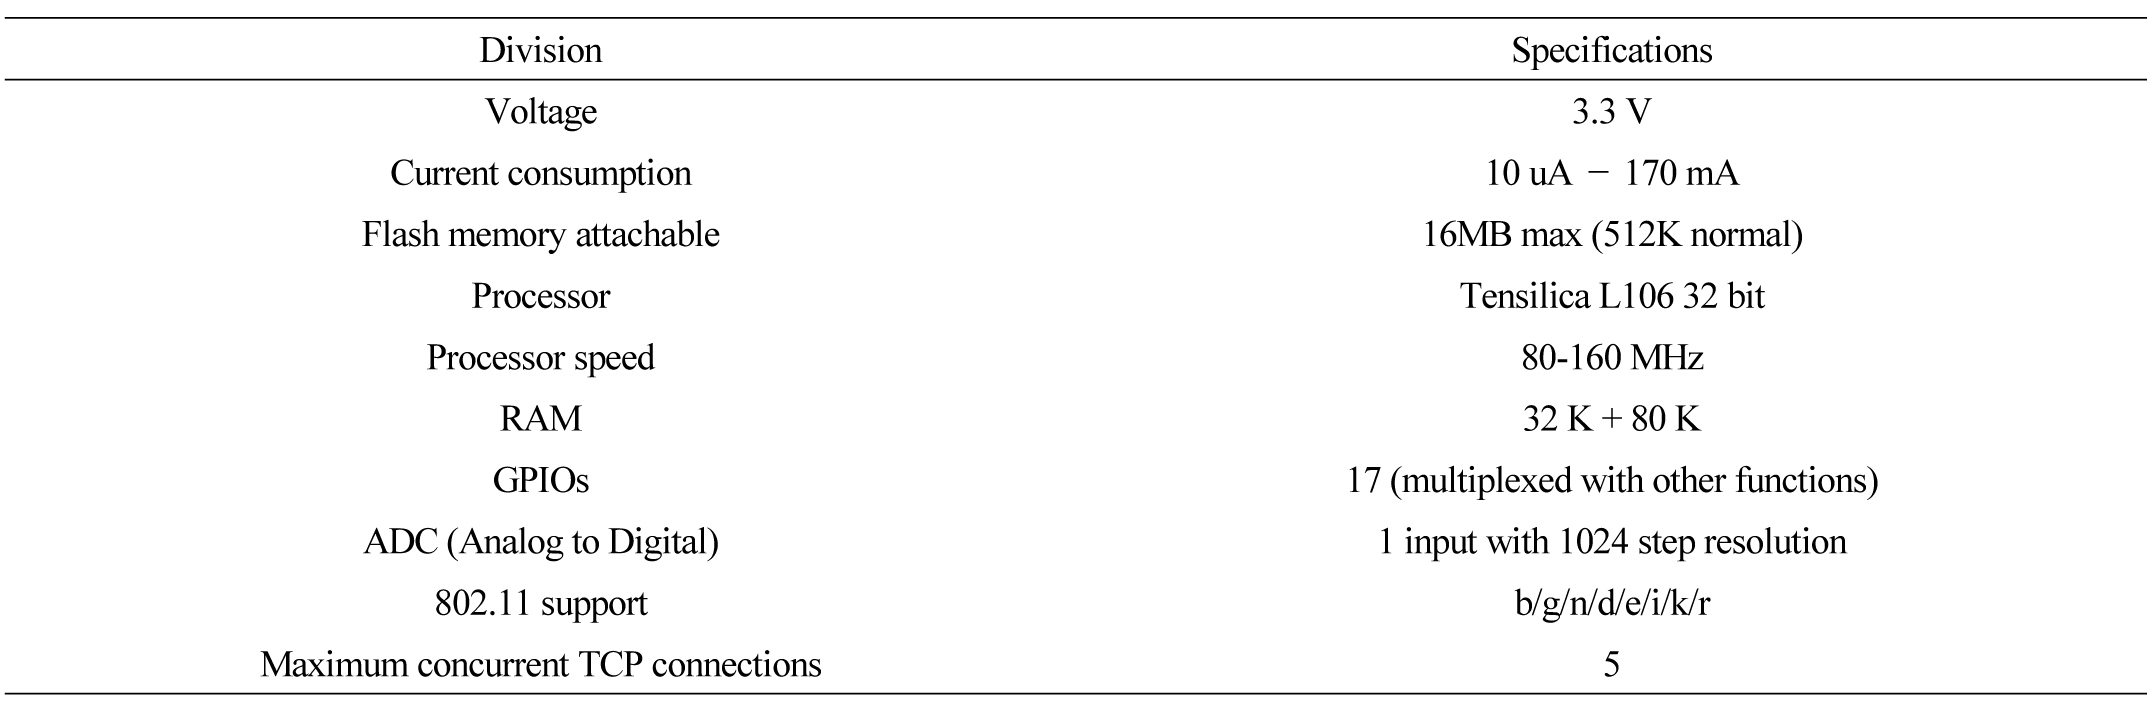
Arduino Uno uses Atmel's 16 MHz microcontroller ATmega 328 capable of connecting multiple peripheral devices across a total of 20 I/O pins, providing connectivity and Table 1 presents technical specifications for the Arduino Uno (Simon, 2011).
3.3 9 Axes Motion Sensor
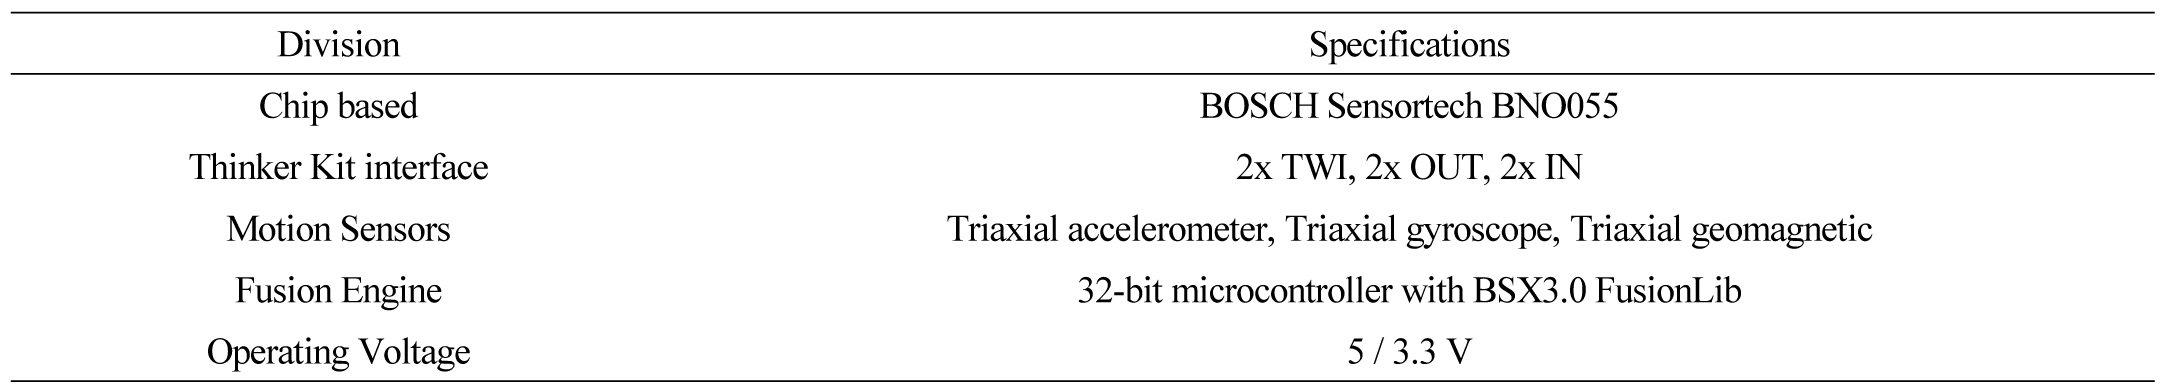
It is based on Bosch's BNO055 absolute orientation sensor, it runs a 3-axes 14-bit accelerometer, 3-axes 16-bit gyroscope, 3-axes earth magnetism, and BSX 3.0 FusionLib Software. In this study, measurements from a 9-axis motion sensor are used to determine the dip direction of the rock slope. Table 2 shows the technical specifications for the 9 Axes Motion Shield.
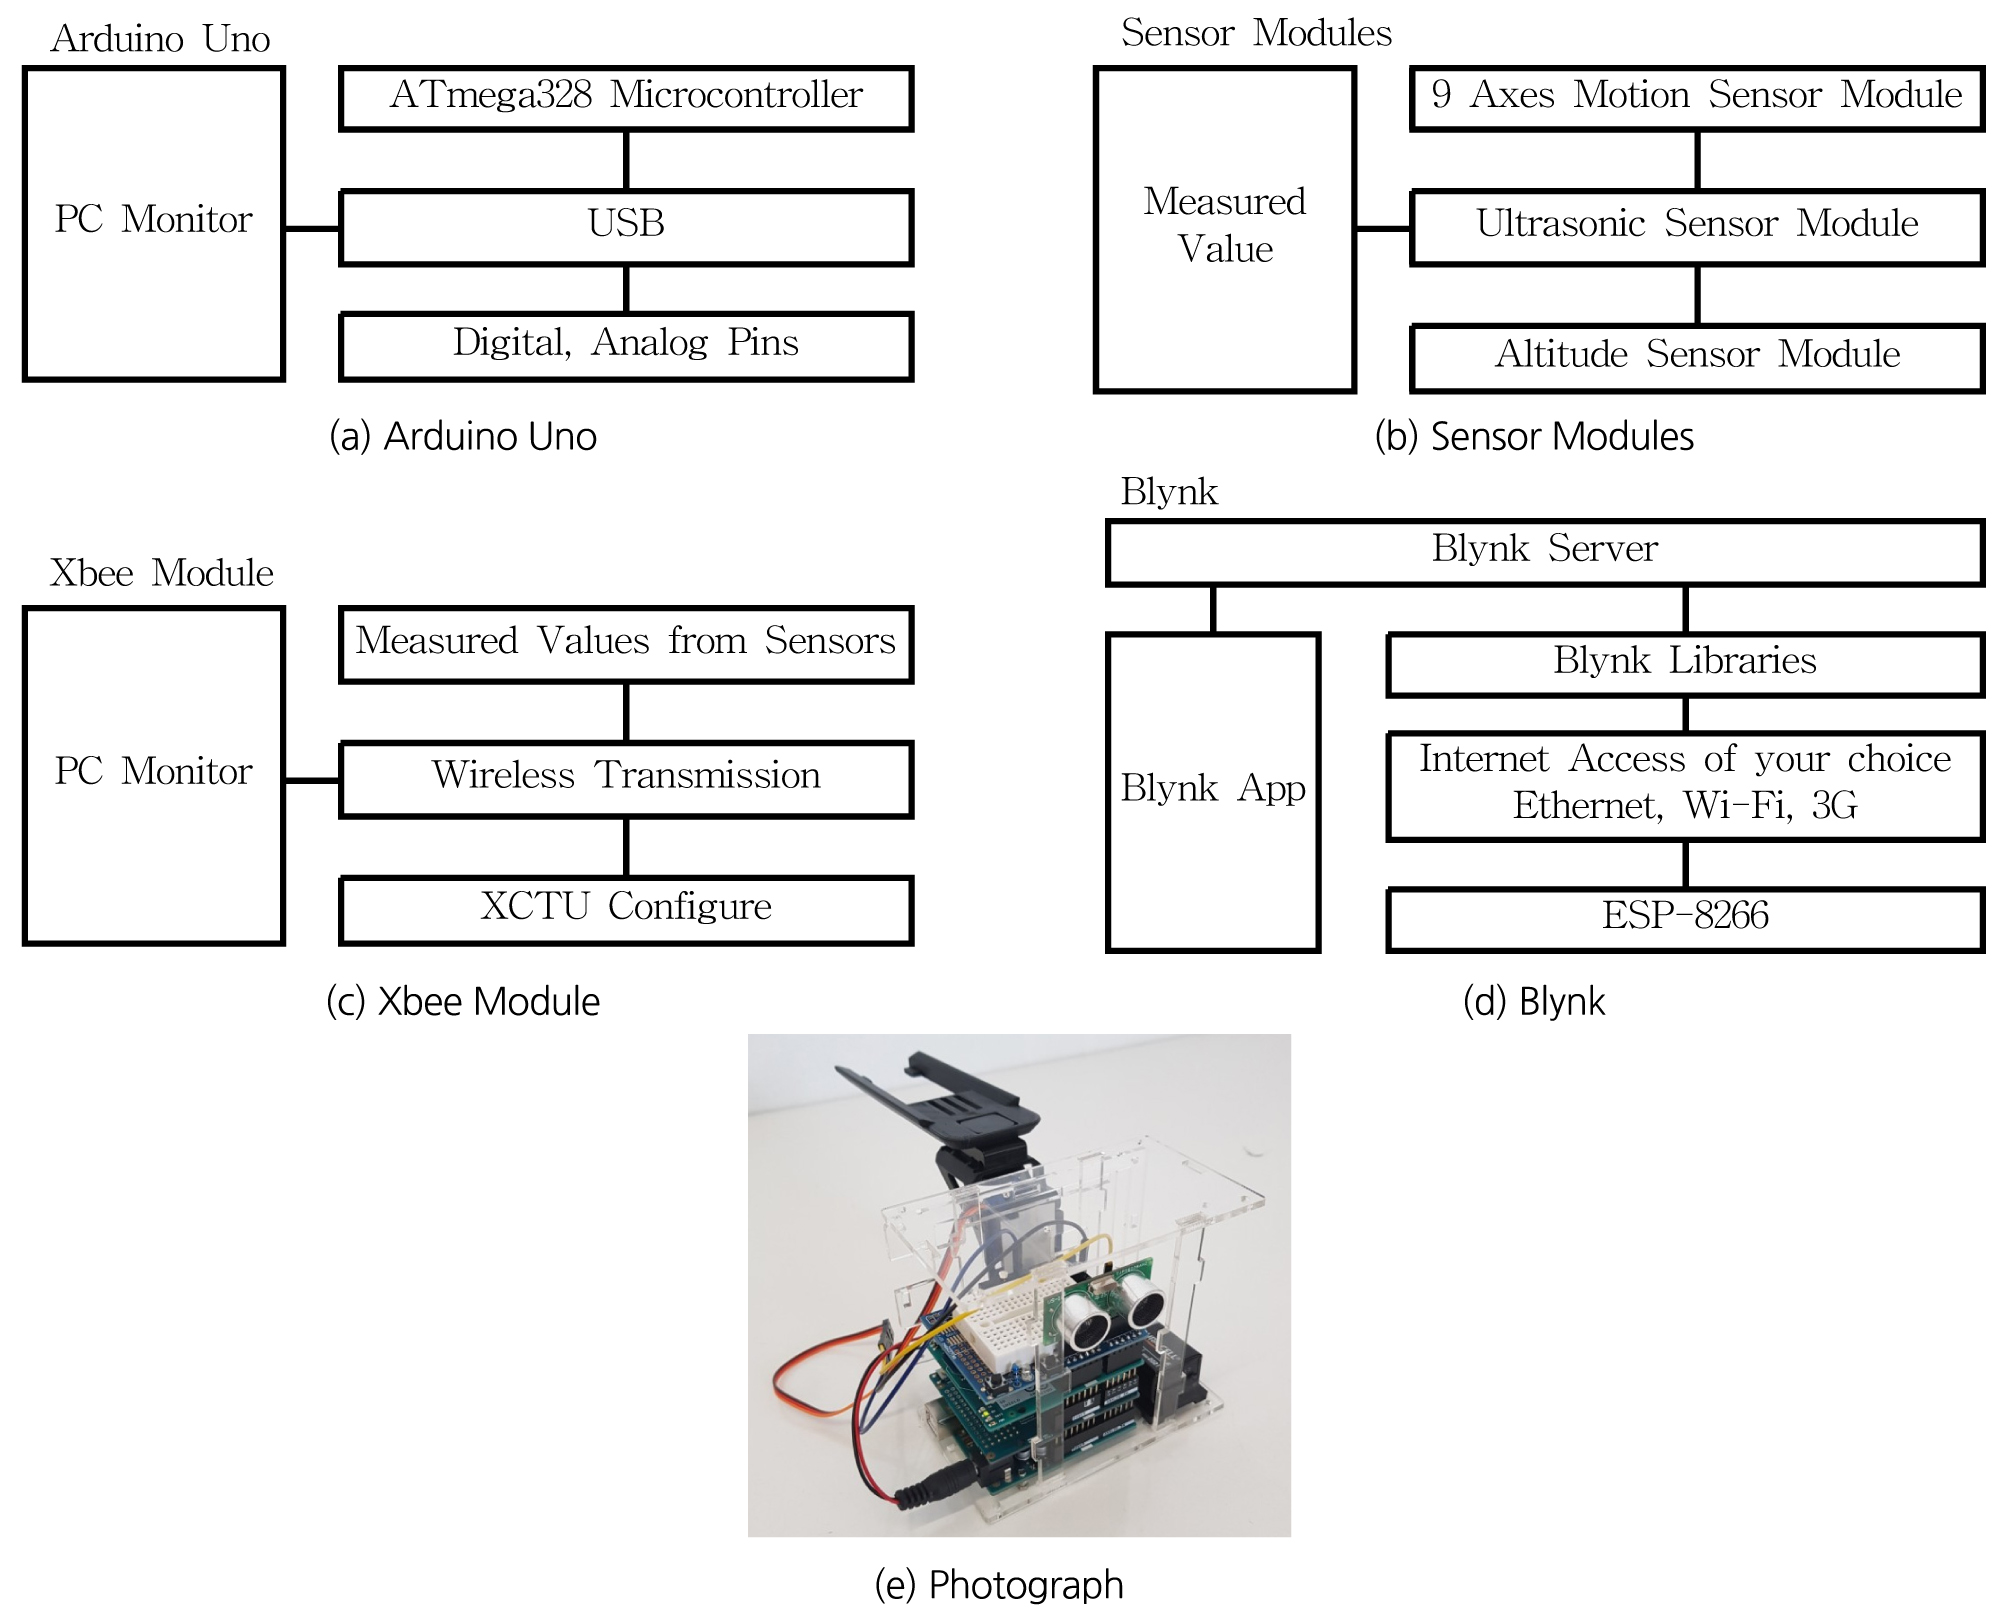
3.4 Ultrasonic Sensor
The ultrasonic sensor module is HC-SR04, which measures 4 meters and has a measuring accuracy of 2 mm. An ultrasonic module consists of a transmission unit, a reception module, and a regulating circuit. In this study, ultrasonic sensors were used to measure the linear distance between the target rock slope and the measuring device. Table 3 shows the technical specifications for the ultrasonic sensor.

3.5 XBee Sensor
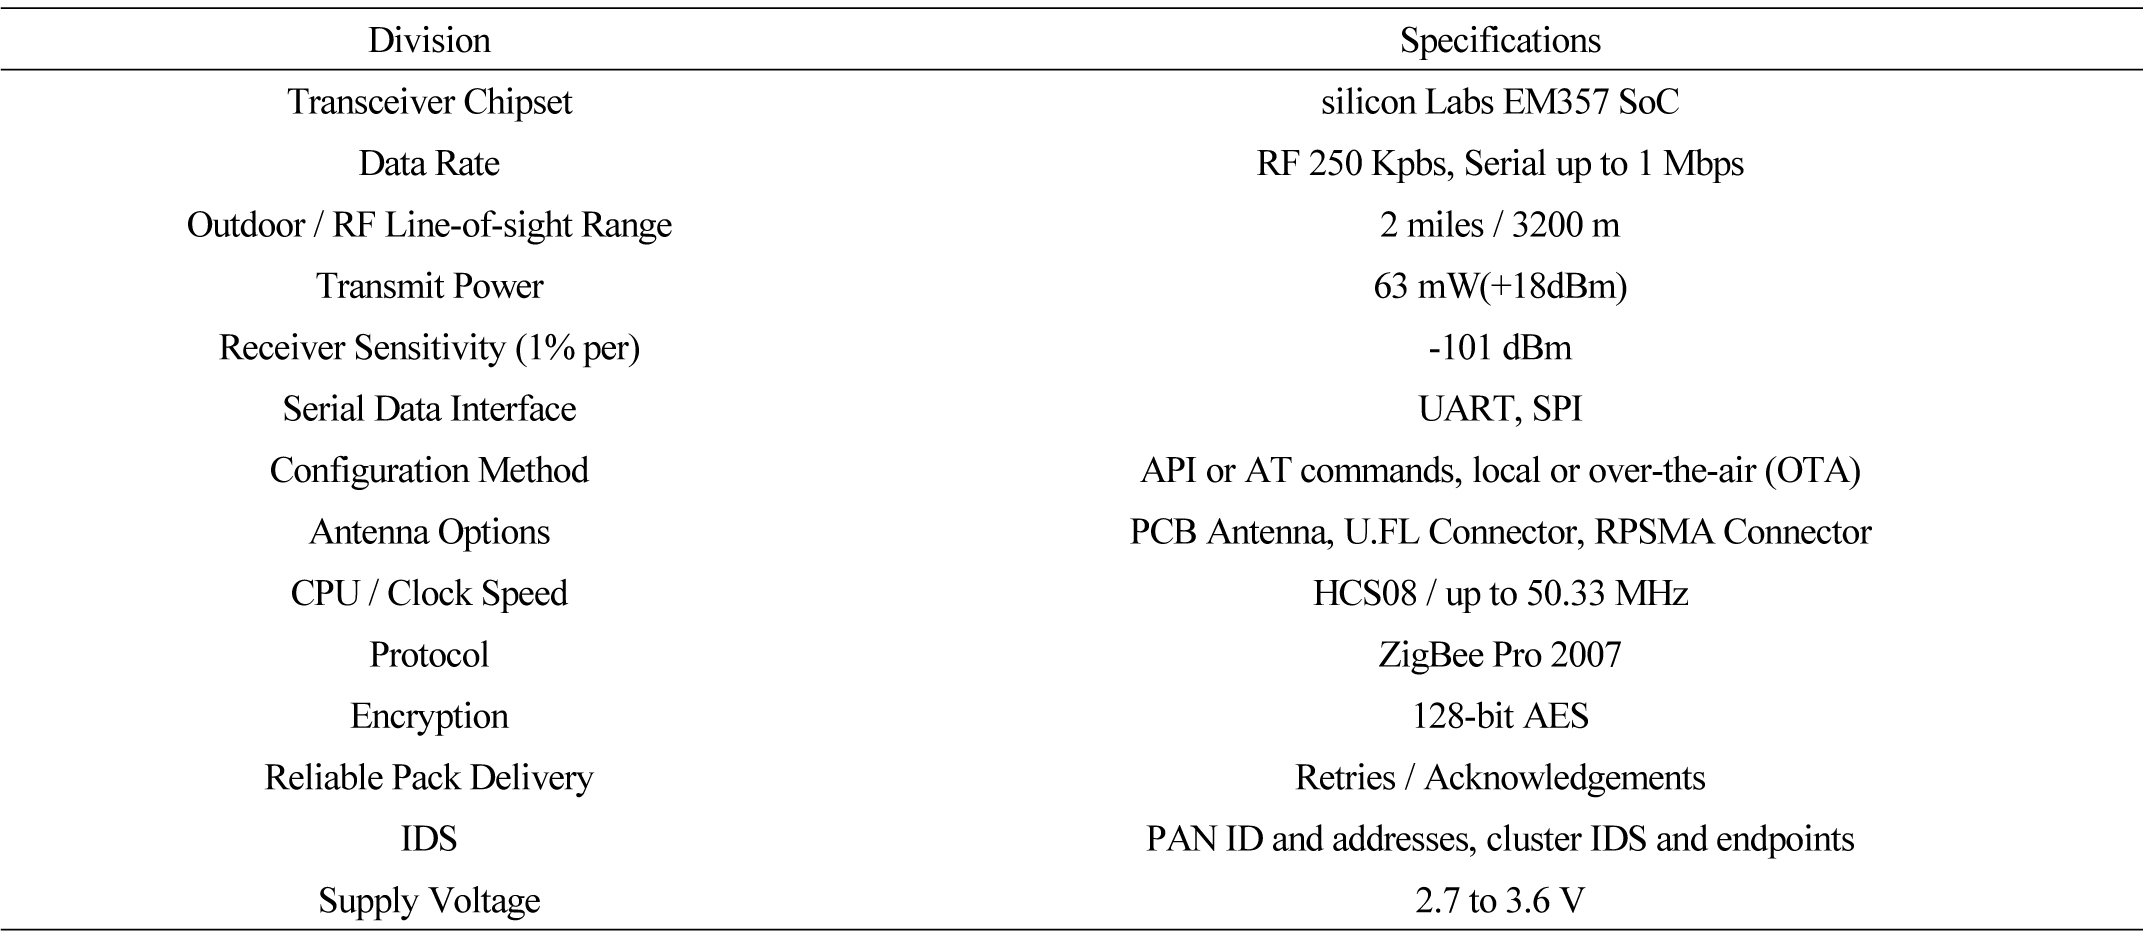
XBee, a communications network module based on the NFC method, is grouped into one-to-one communication, star topology and mesh type topology. The XBee module used in this study applied the Zigbee communication protocol, while the topology applied one-to-one communication. Table 4 shows the technical specifications for the xbee module.
3.6 Software of data acquired
Arduino’s integrated development environment is a cross-platform application software developed based on Java and C, which is capable of compiling and uploading, and using C ++ language base for arduino operation (Hagan, 1980).
In this study, using sketches, data from both the Arduino Uno and the sensors were printed on the mobile computer.
3.7 Servo Motor
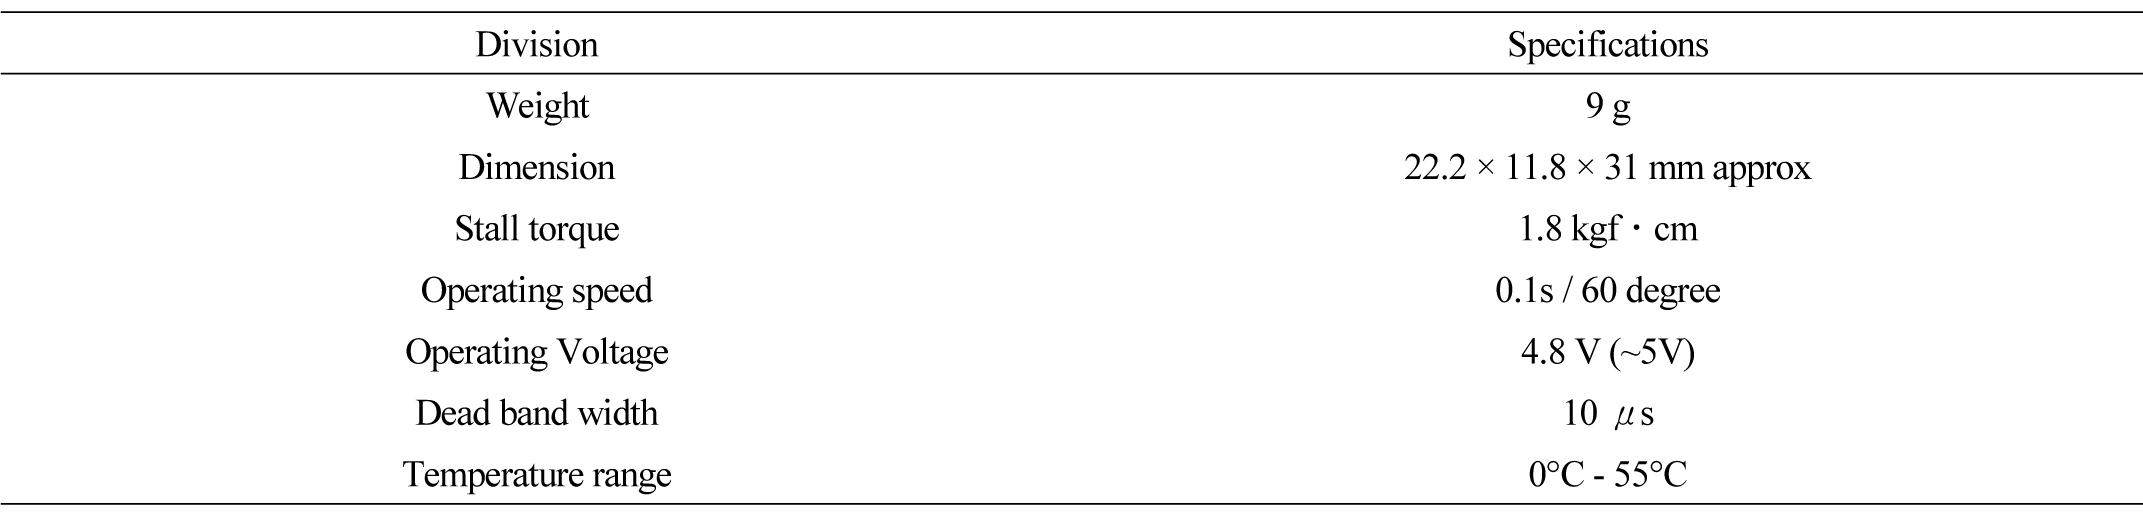
With TowerPro’s SG-90 product, SG-90 is a small, lightweight product with a high output power. The servo can rotate about 180 degrees and is operated by three wires. It is used in this study to adjust the angle of the Drone Measure system. Table 5 lists technical specifications for SG-90.
3.8 Unmaned Aerial Vehicle
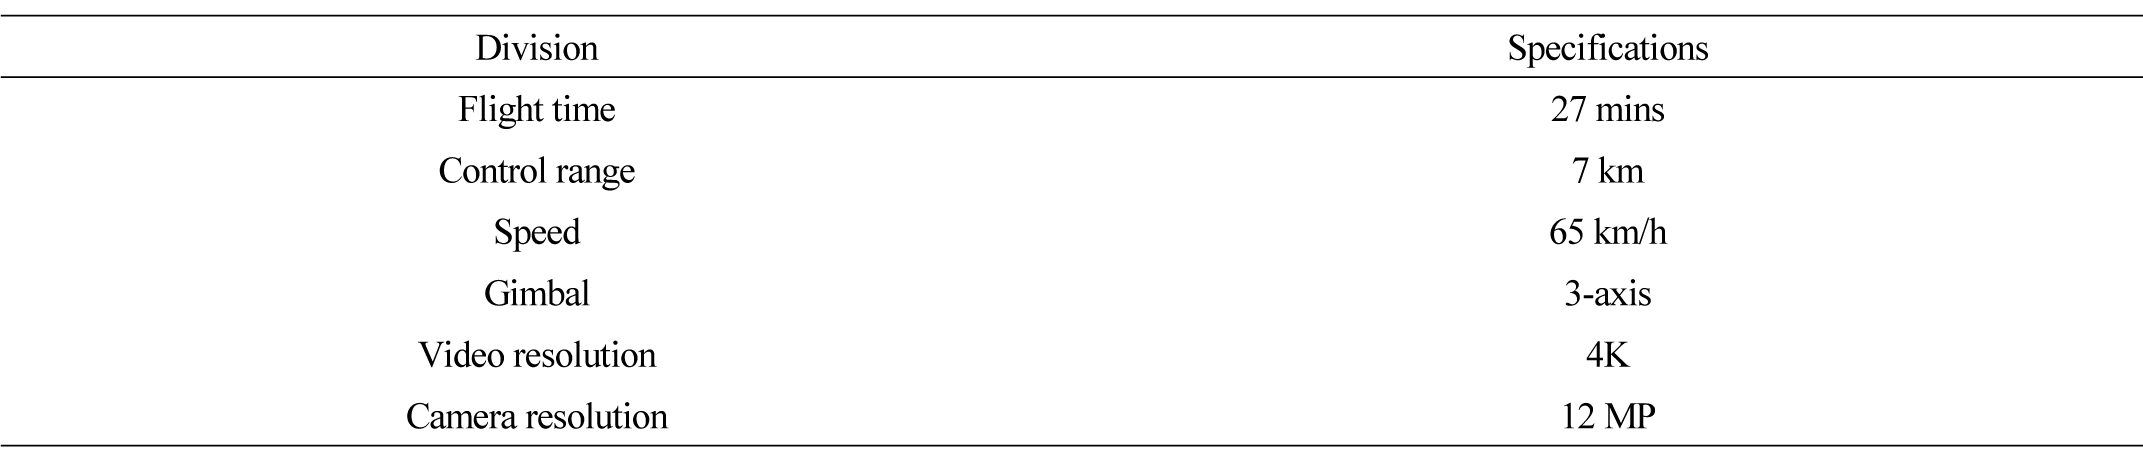
It is a DJI's MAVIC PRO product, which uses forward and downstream vision sensors to accurately hovering rooms and satellites where they are not captured, and also maintains a fixed altitude on the uneven terrain. Table 6 shows the technical specifications for the MAVIC PRO.
3.9 ESP 8266
ESP 8266 is a micro-controller designed by Espressif Systems, and since a large number of ESP-xx modules operate only at 3.3 V, a 3.3 V power supply is required.
The GPIO (General Purpose Input Output) is a pin that can be controlled by the ESP 8266 module, like the pin in the Arduino, with a different number of pins available for each ESP-xx module. Table 7 lists technical specifications for ESP 8266.
3.10 Blynk
Blynk is a platform that enables iOS and Android applications to control the makers of IoT devices such as Arduino and Raspberry Pies, and it is a platform that supports virtual, hardware-to-hardware connectivity.
4. Test Result
4.1 Result of Joint Data
For the purpose of making use of the joint survey system applied to this study, the dip angle was increased from 50° to 10° for each pair of surfaces, and measured from 10° to 90° for the dip direction. In the case of a 50° dip angle, the dip direction is measured from 90° to 140° and examined until the angle is 80°.
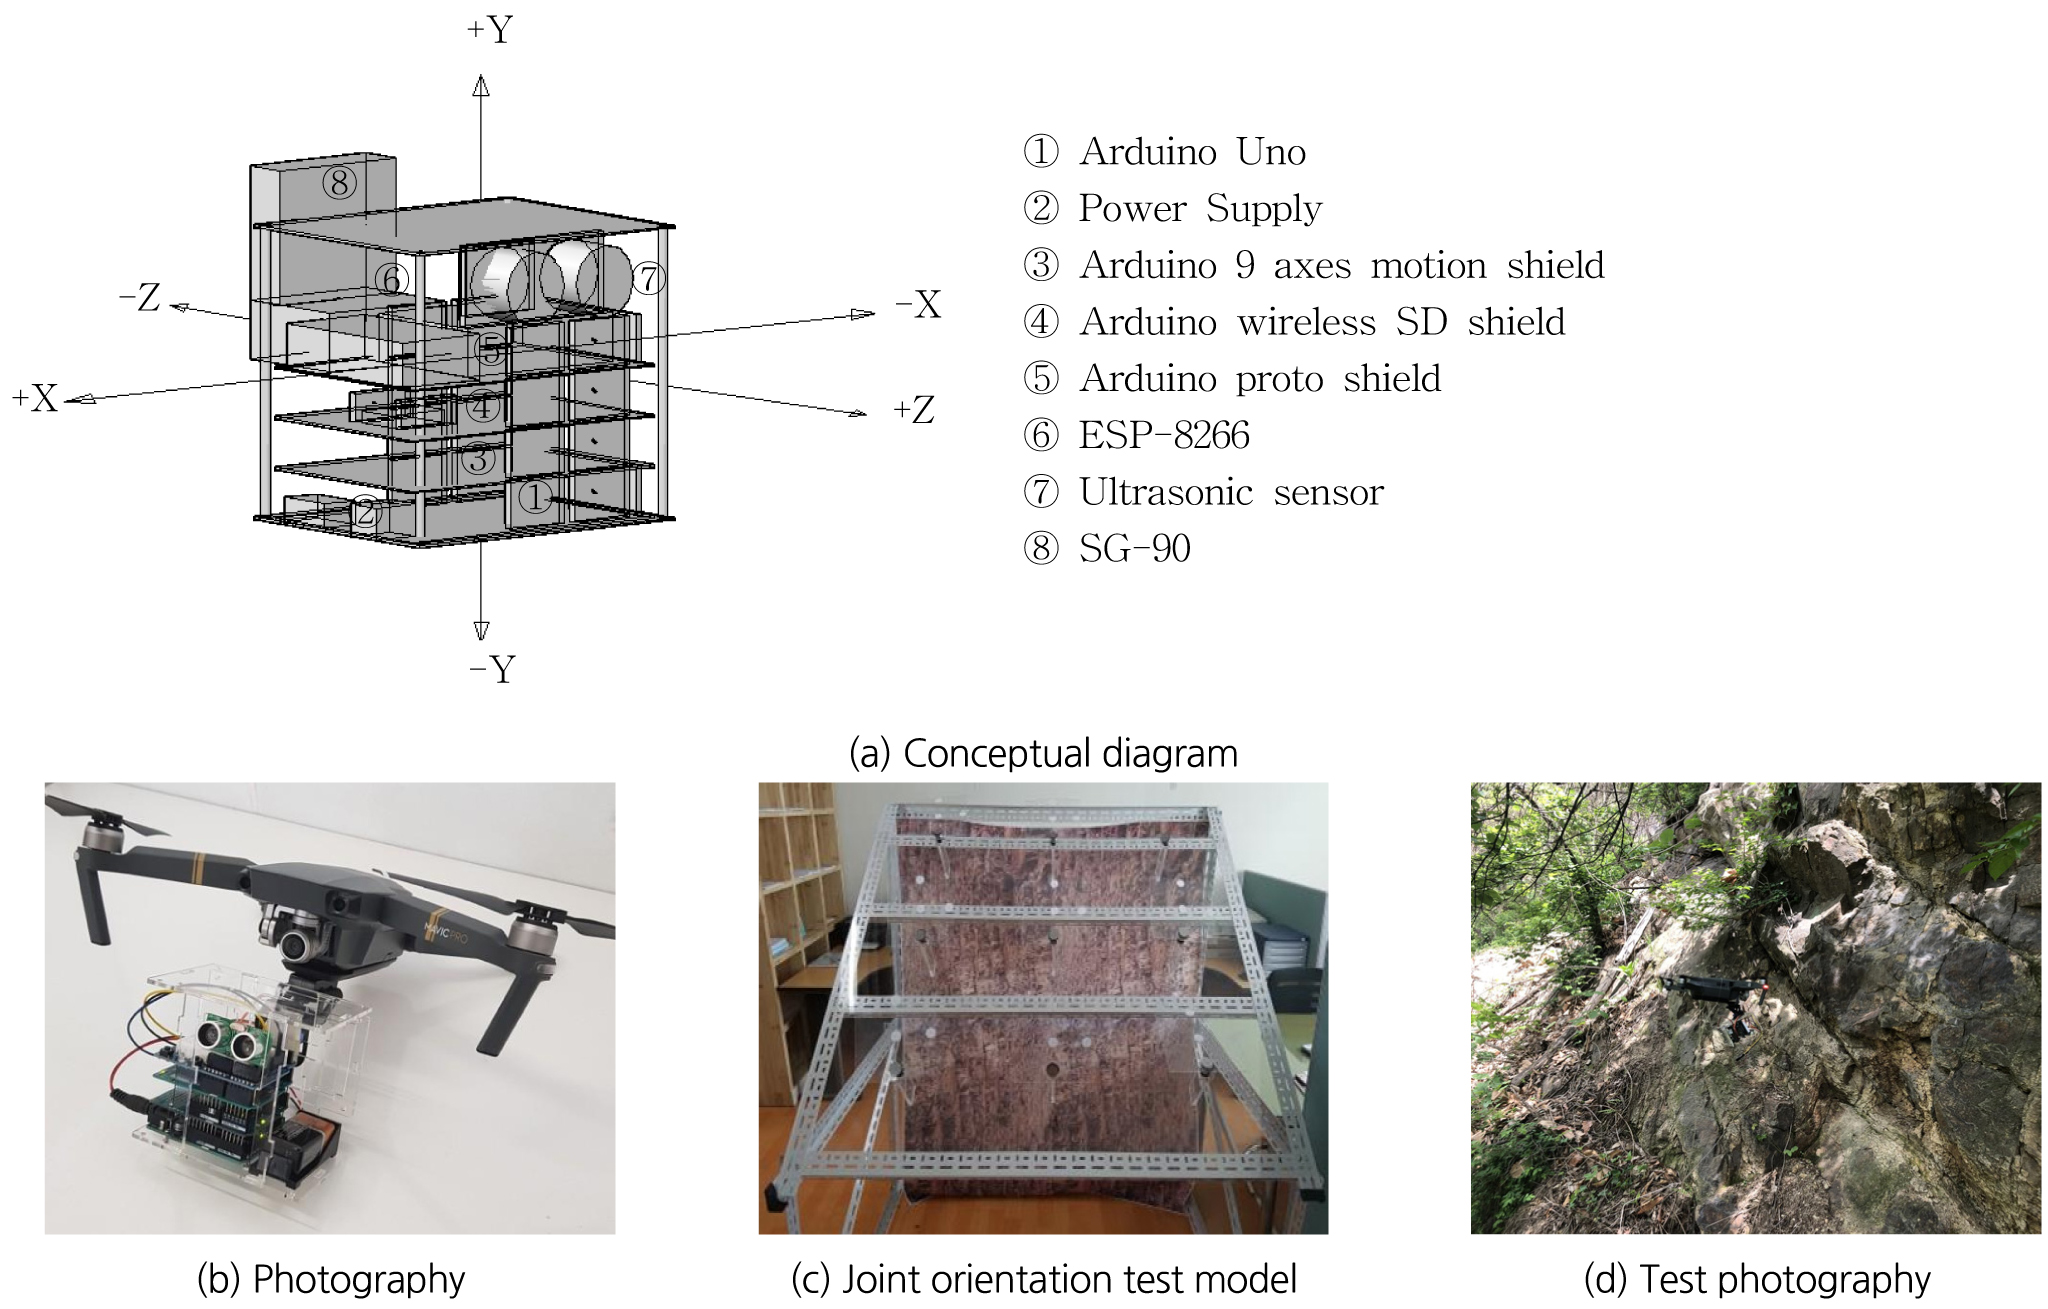
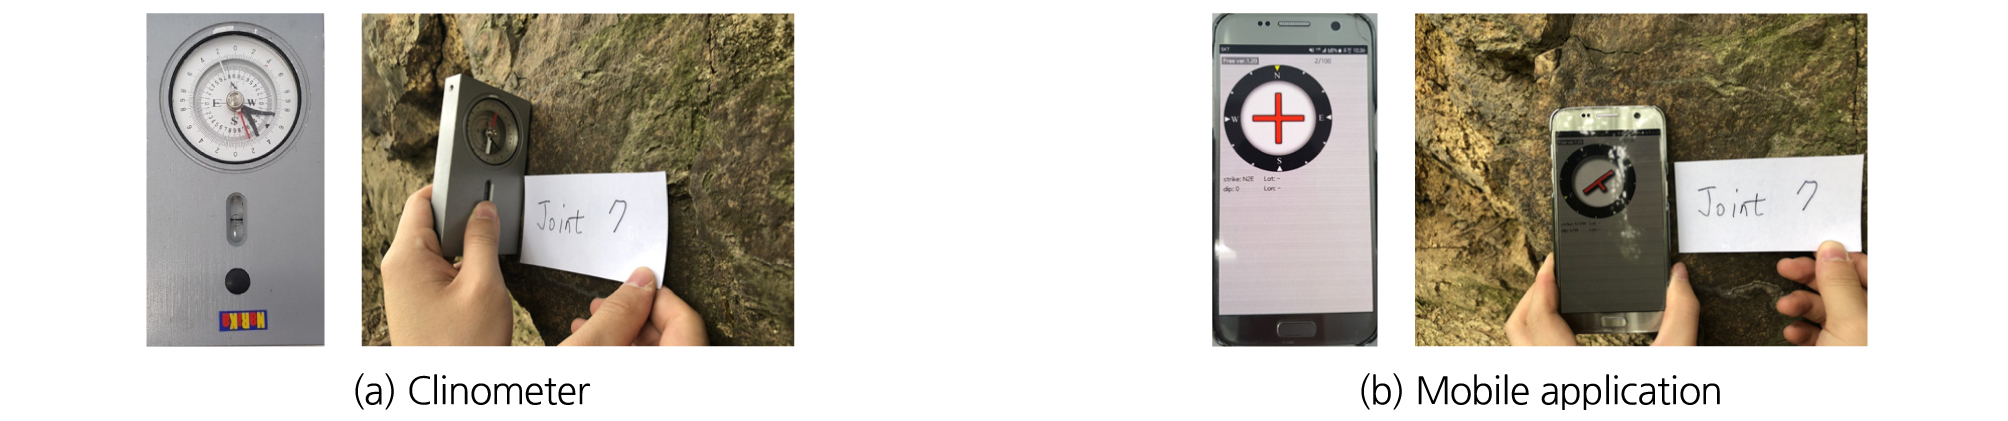
In the lab model test, the results of measurements using a clinometer were compared with the results obtained by a joint survey system. Fig. 4 shows the hardware configuration diagrams of the joint survey system. Fig. 5 represents a conventional survey device.
In this study, the data from lab tests were used to calculate the orientation of the joint and compared to the actual joint data obtained using the clinometer and mobile application.
4.2 Reliability Analysis of Data
40 joints and 20 joints were selected to directly compare the joint orientation and to analyze reliability in the lab test and in the field test. As a result of the measurement error in the dip angle and the measured error in the dip direction of the slope of the clinometer are ± 5° and ± 10° respectively (Ewan and West, 1981), the machine error in the clinometer may be produced in ± 1° to 2°. It has been analyzed that no data exceeds the tolerance range (dip : ± 7°, dip direction : ± 12°) set in this study (Park et al., 2015).
Table 8. Comparison of each joint orientation in the lab test (Clinometer and Drone Measure System and Mobile application) |
|
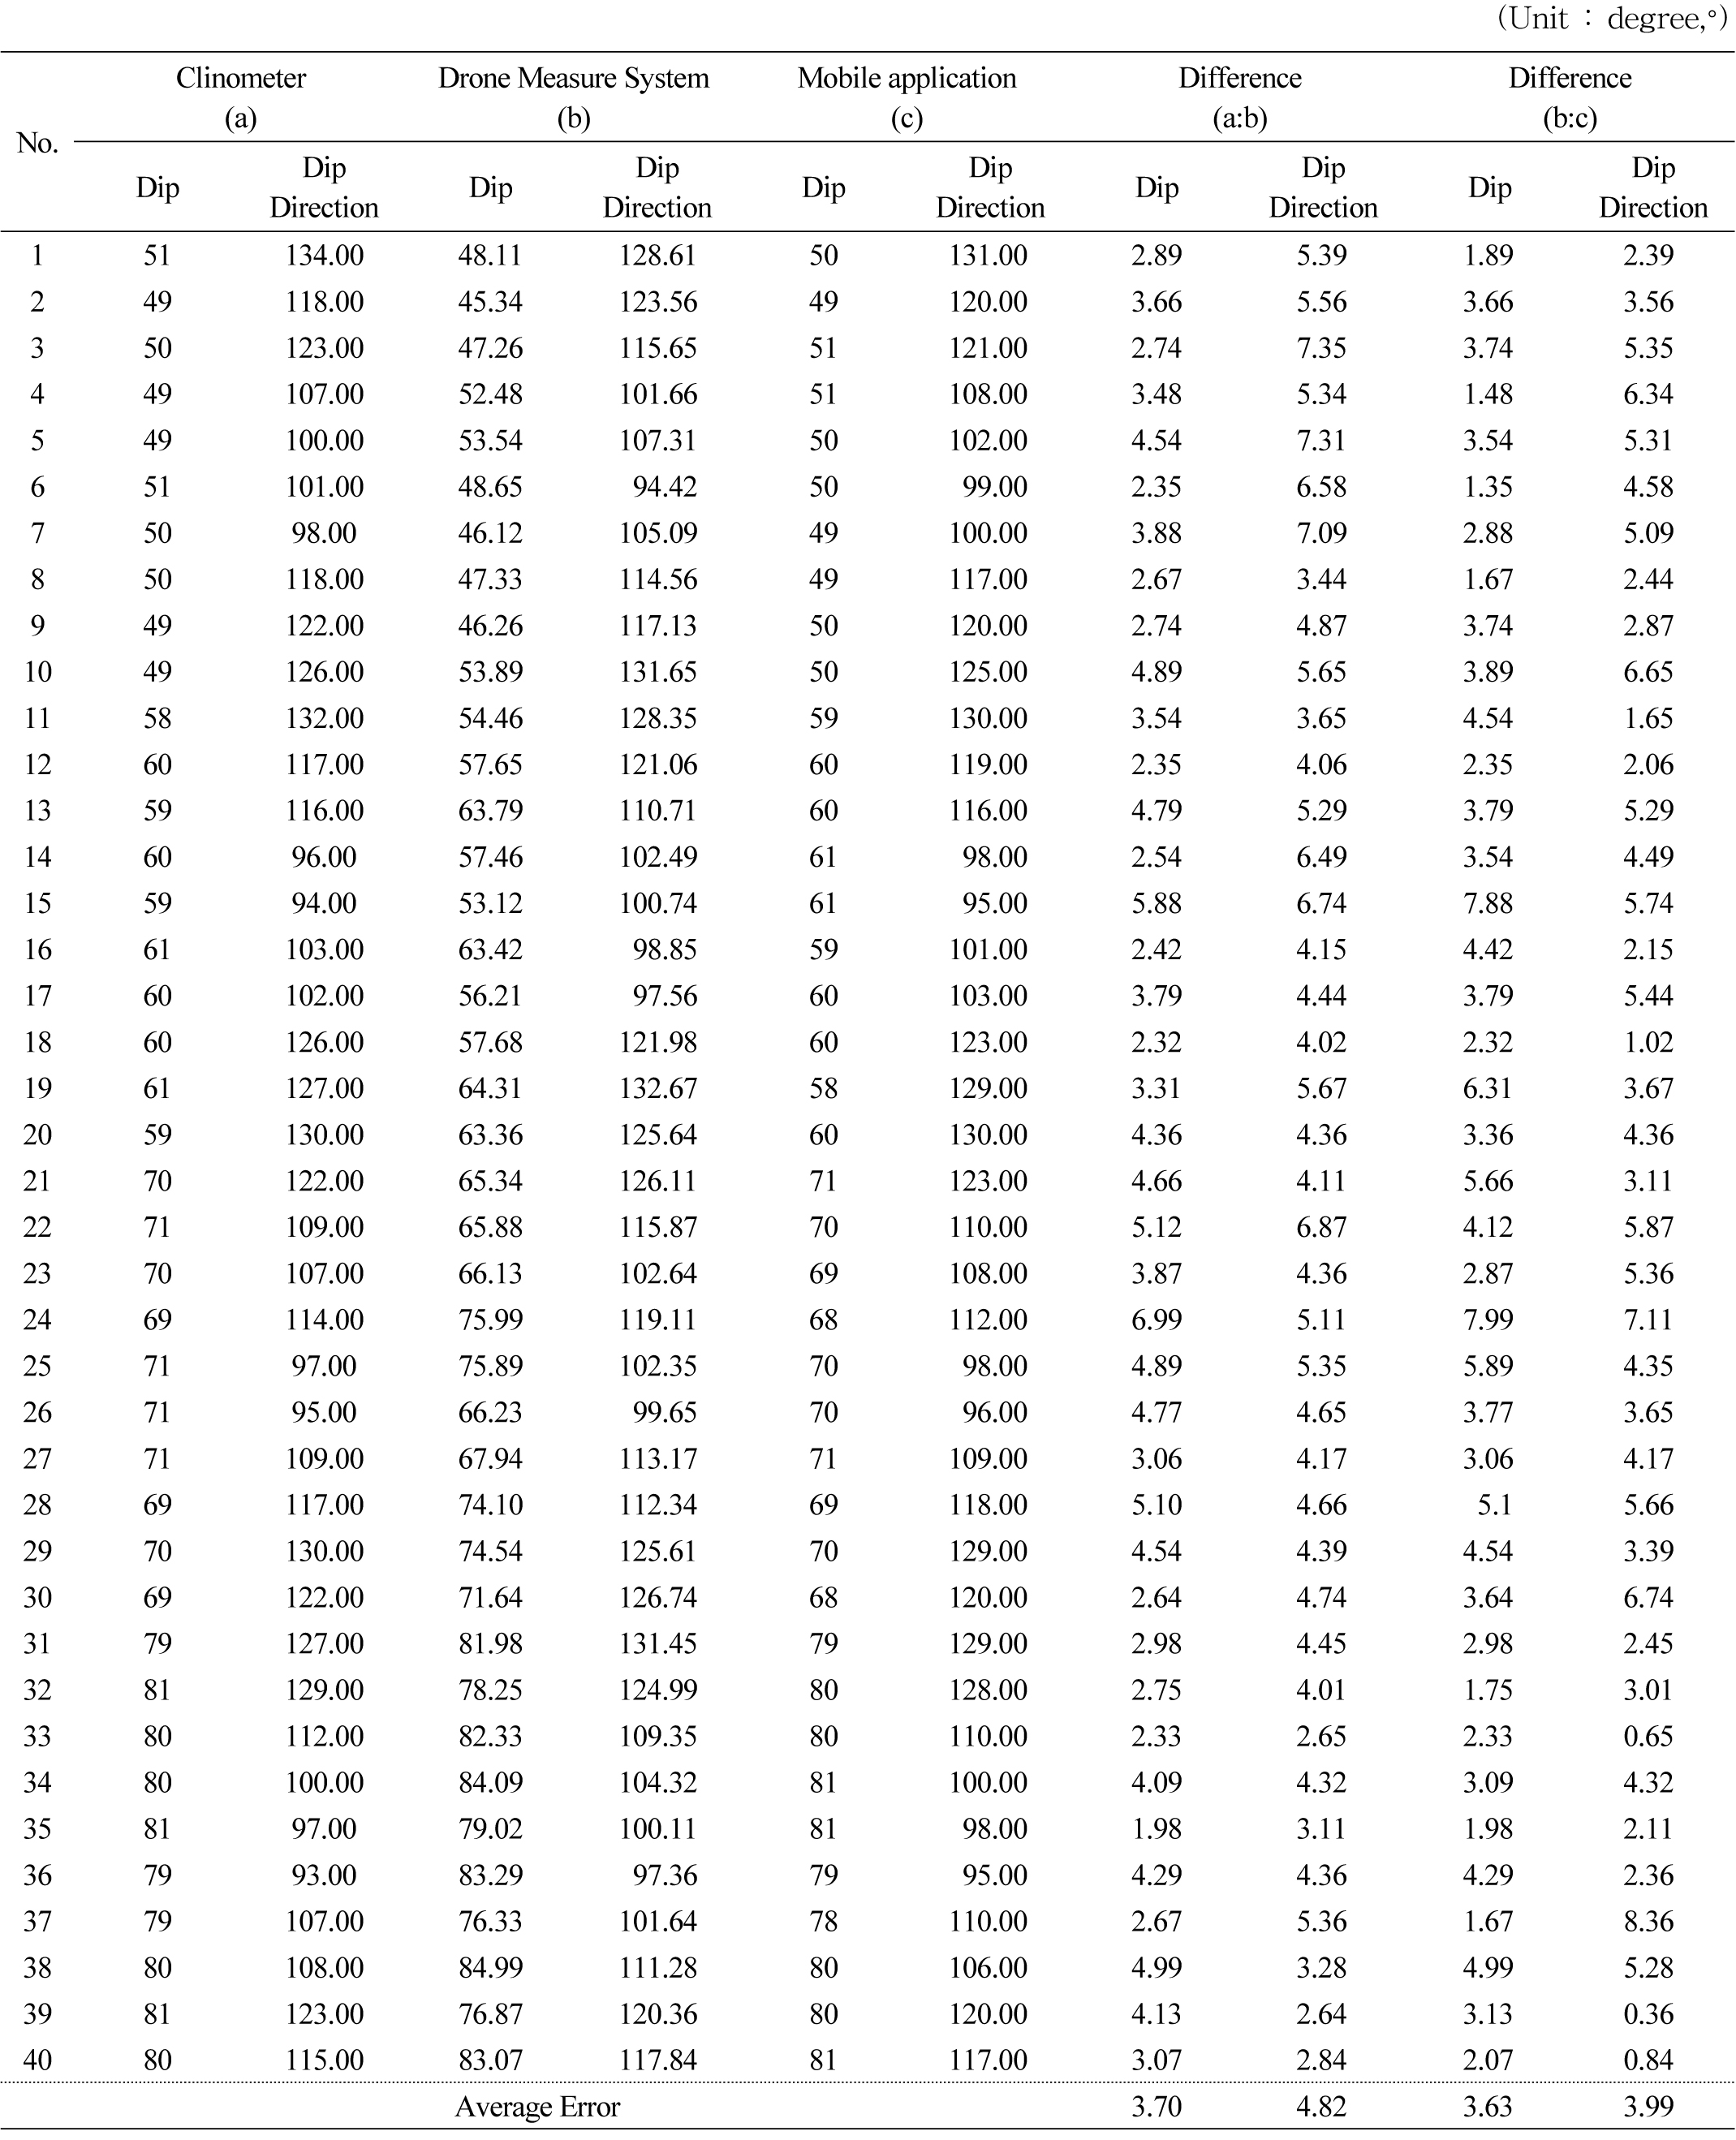
Table 9. Comparison of each joint orientation in the field test (Clinometer and Drone Measure System and Mobile application) |
|
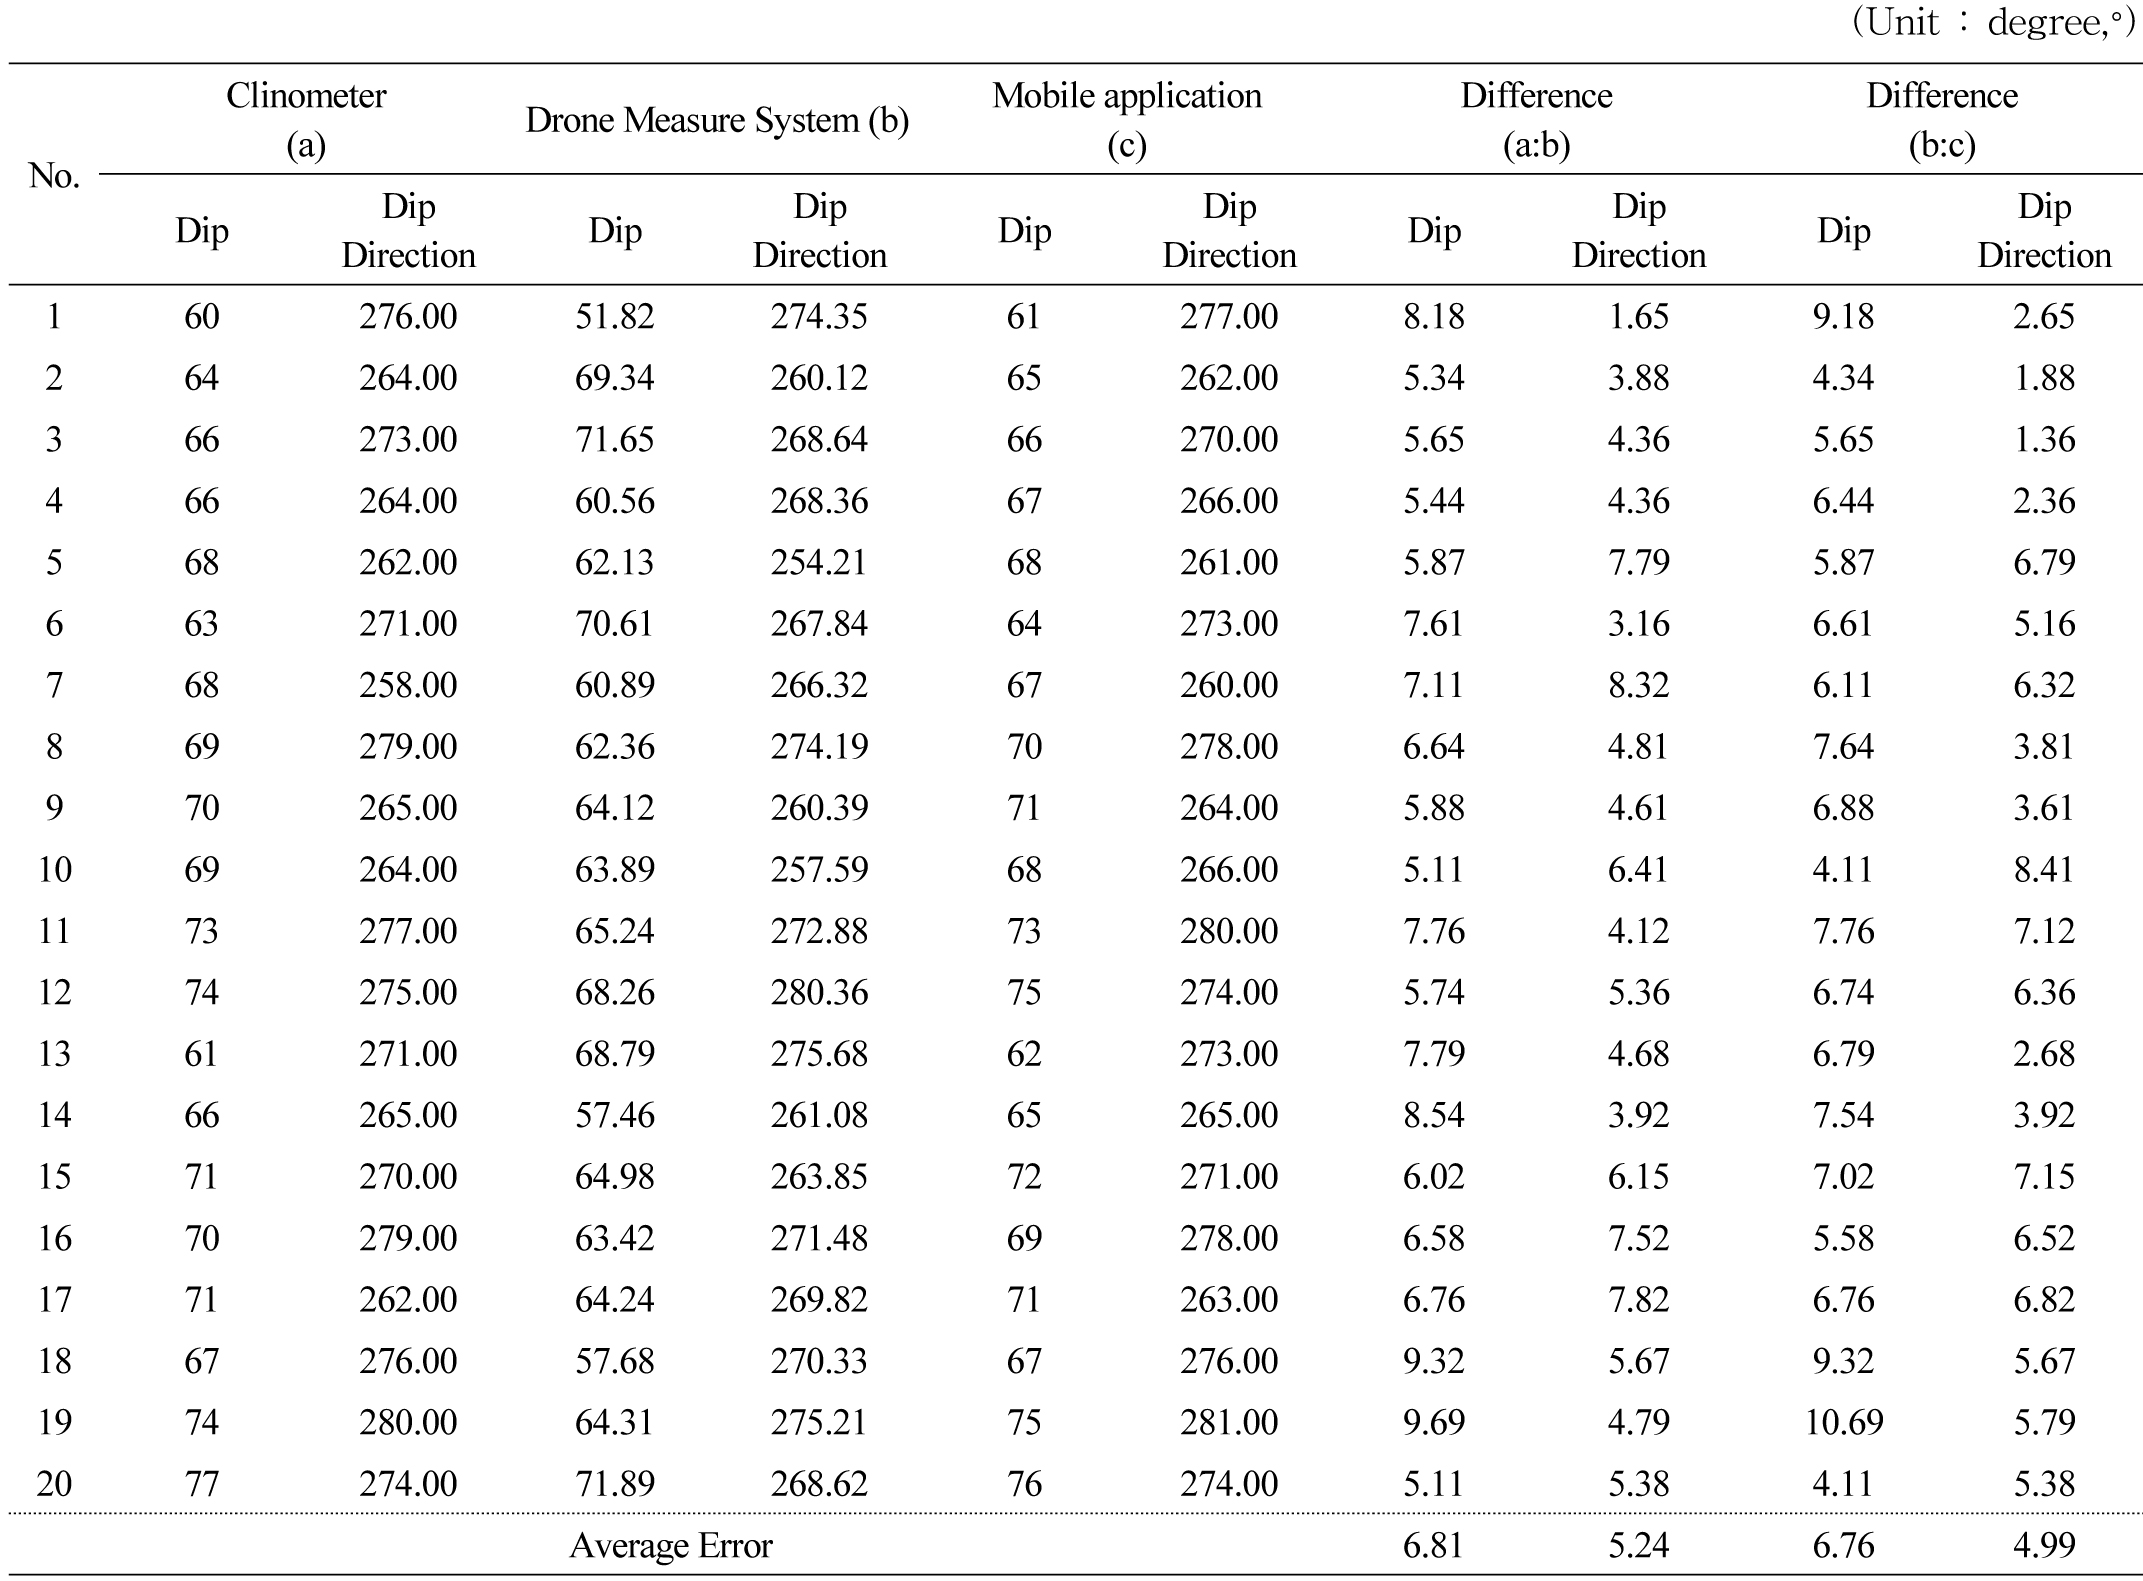
Table 8 compares the results of the 40-validated dip / dip direction measurements, with the mean error for the 40 dip / dip directions being ± 3.63° / ± 3.99° as shown in Table 8. Table 9 compares the results of the 20-validated dip / dip direction measurements, with the mean error for the 20 dip / dip directions being ± 6.81° / ± 5.24° as shown in Table 9. It has been analyzed that no data exceeds the tolerance range set in this study.
4.3 Analysis of Error Cause
In comparing the direction of the joint using the clinometer and the Drone Measure System the cause of the maximum error is determined by the difference in the measurement method of the joint surface.
It is assumed that, when using the Drone Measure System to obtain the joint orientation data, data errors are generated due to the effects of the refraction of the ultrasonic sensors, the effects of magnetic fields of the magnetic sensor, the drone’s propeller noise, wind speed and the effects of temperature.
4.4 Analysis Result of the stereographic projection method
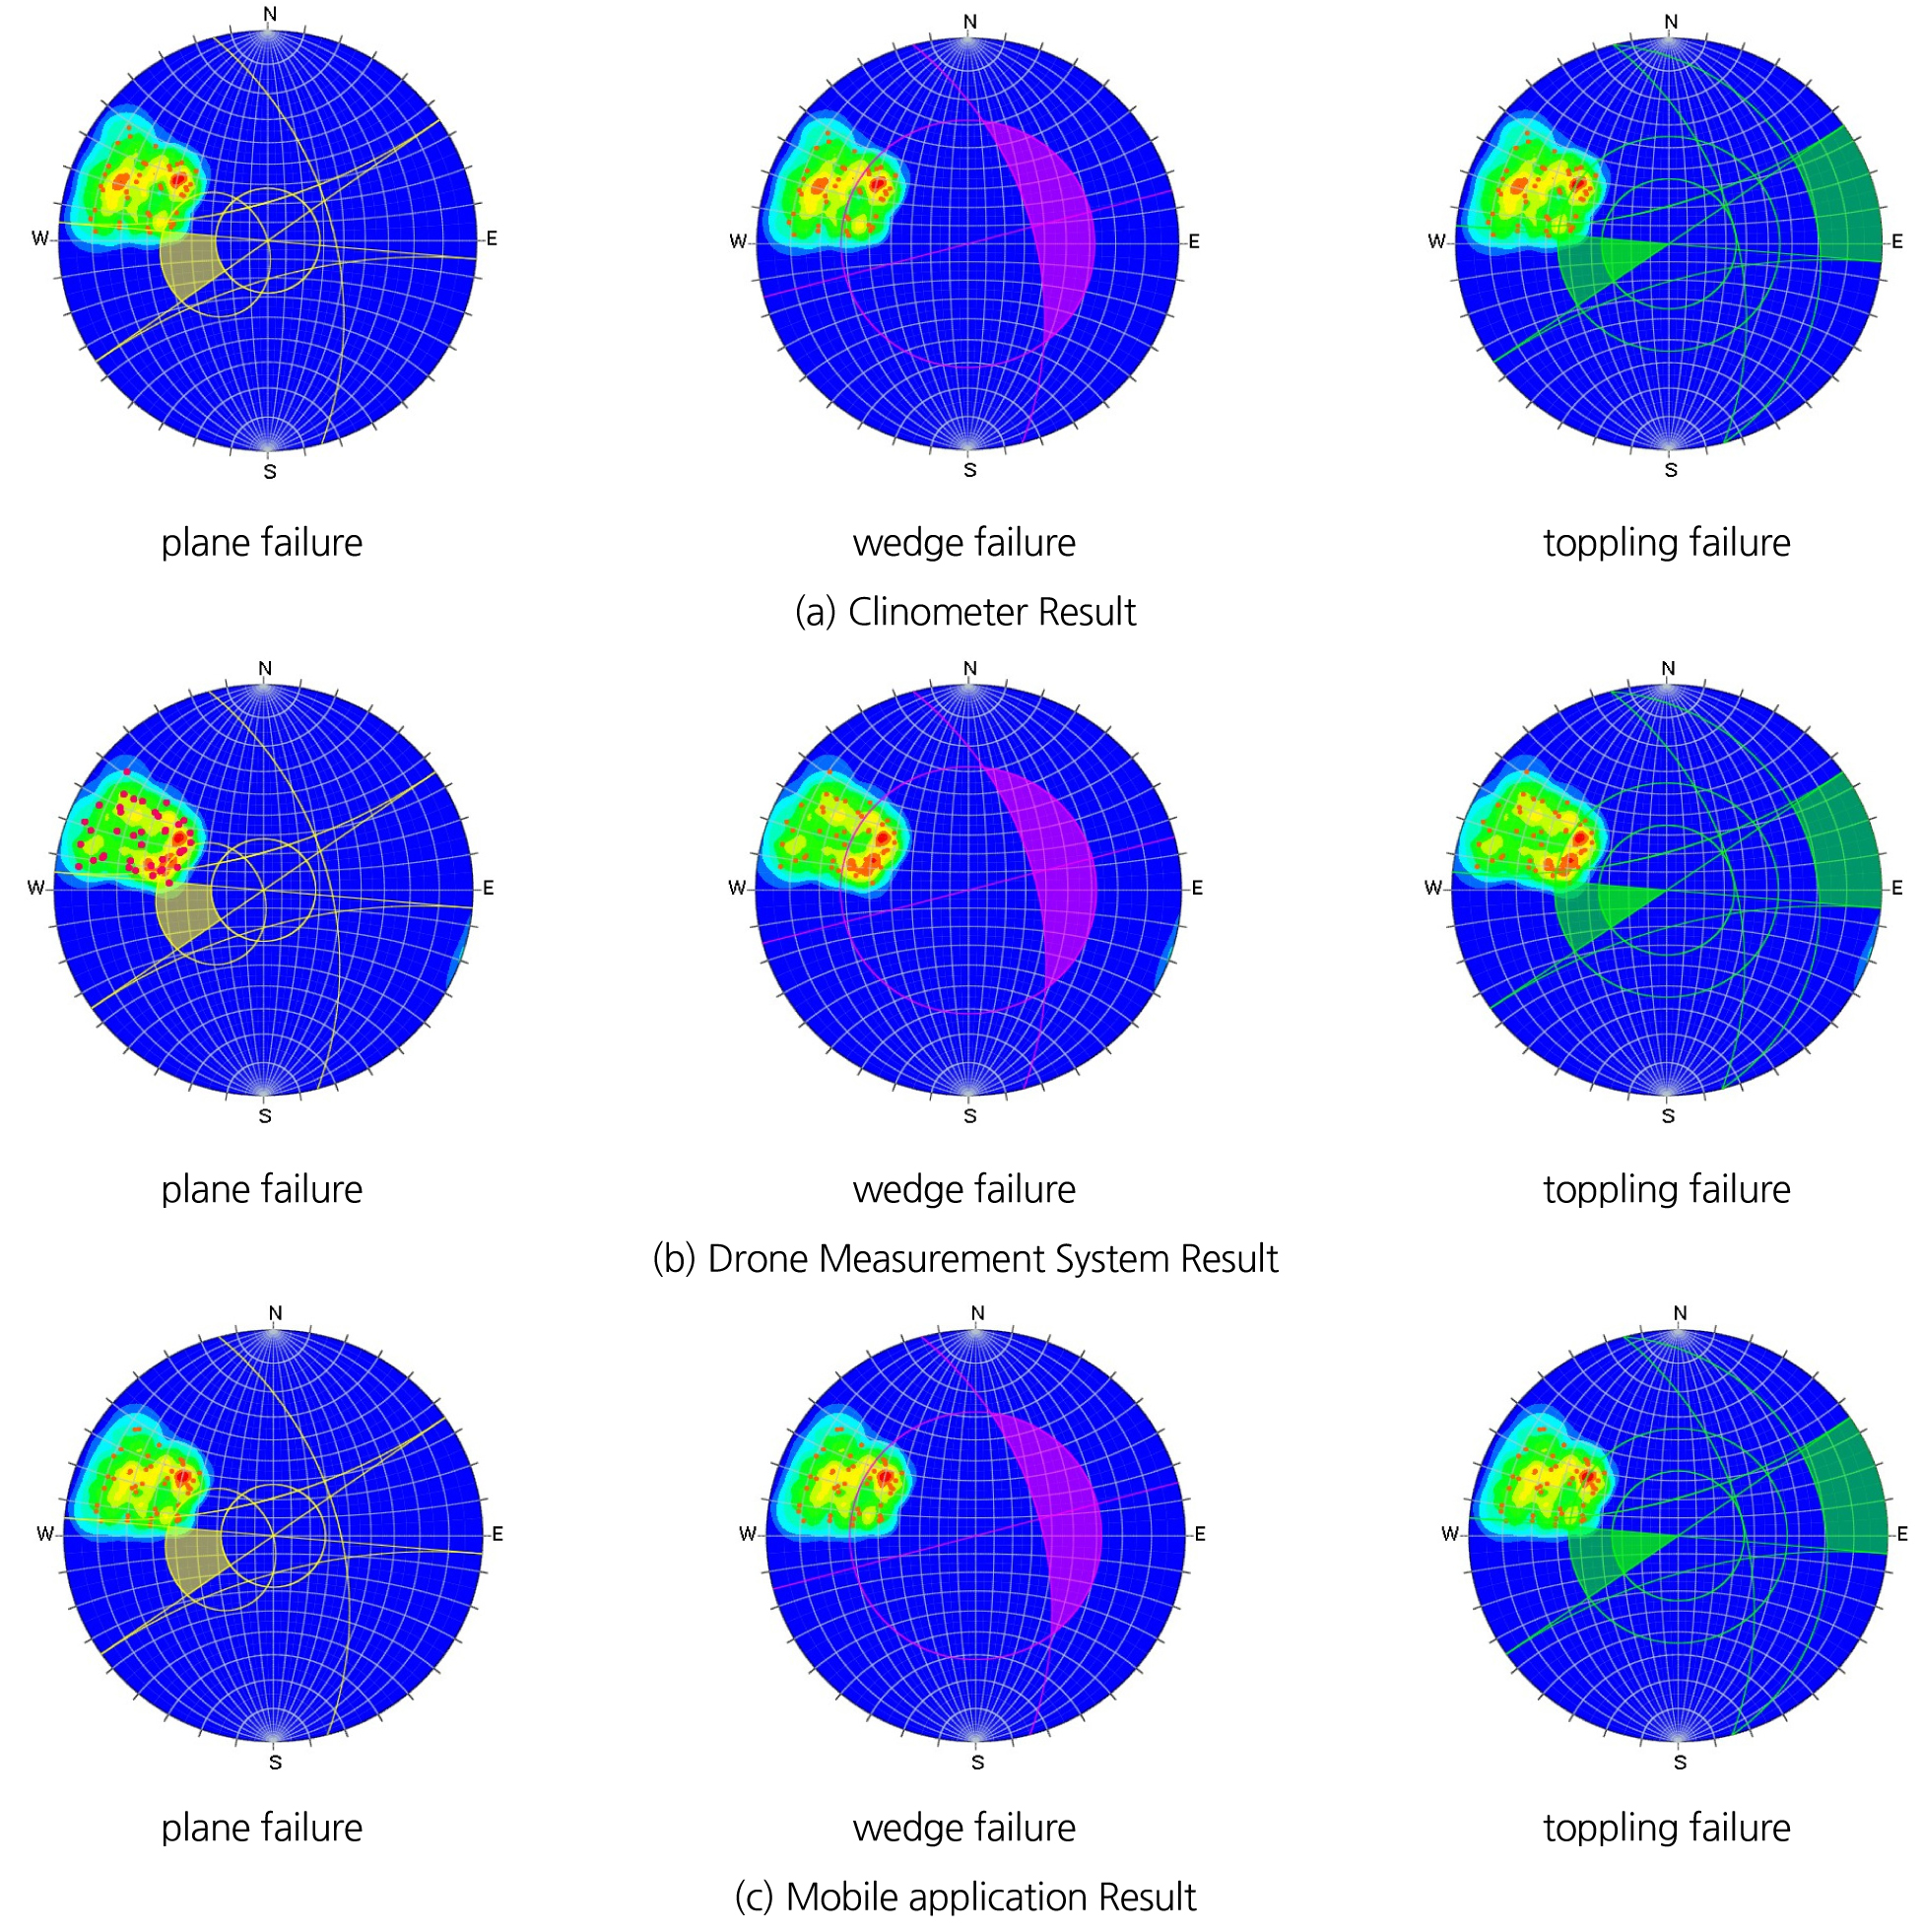
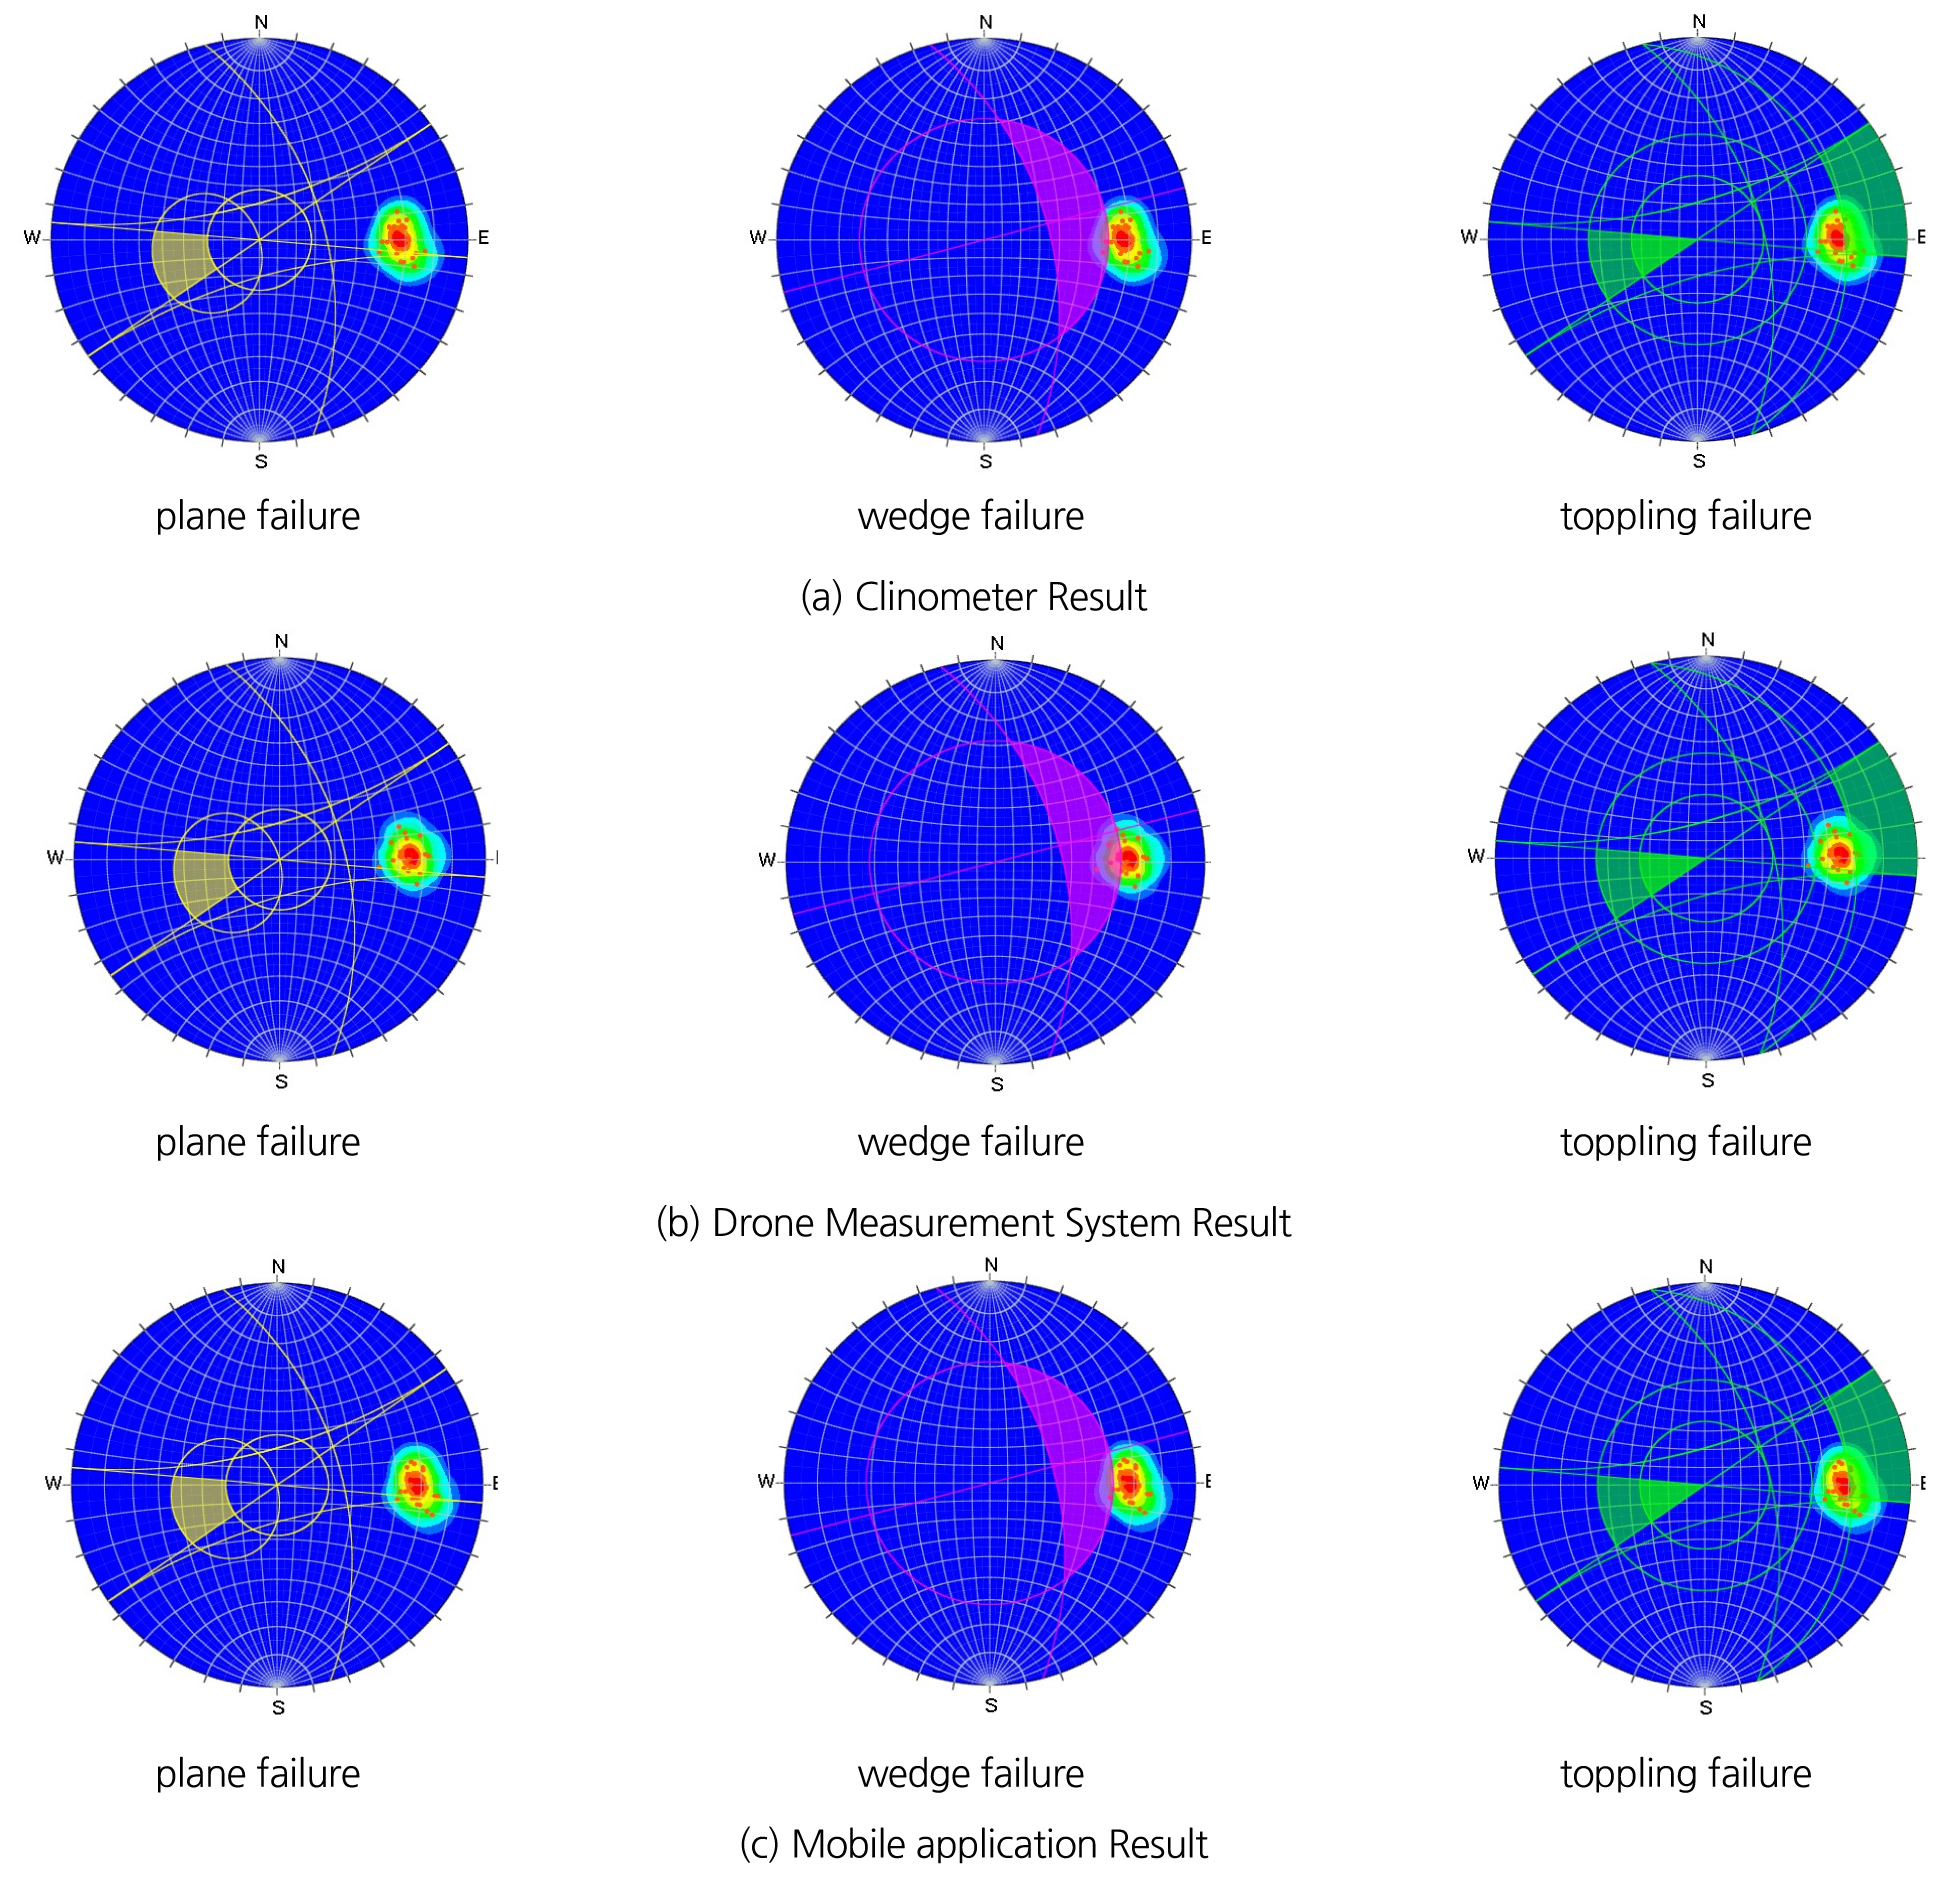
In the data analysis program, we measured the joint in the model slope and found that a total of 40 joints in the lab test and 20 joints in the field were measured, and depending on the orientation of the joint, a variety of joints were developed in the model slope.
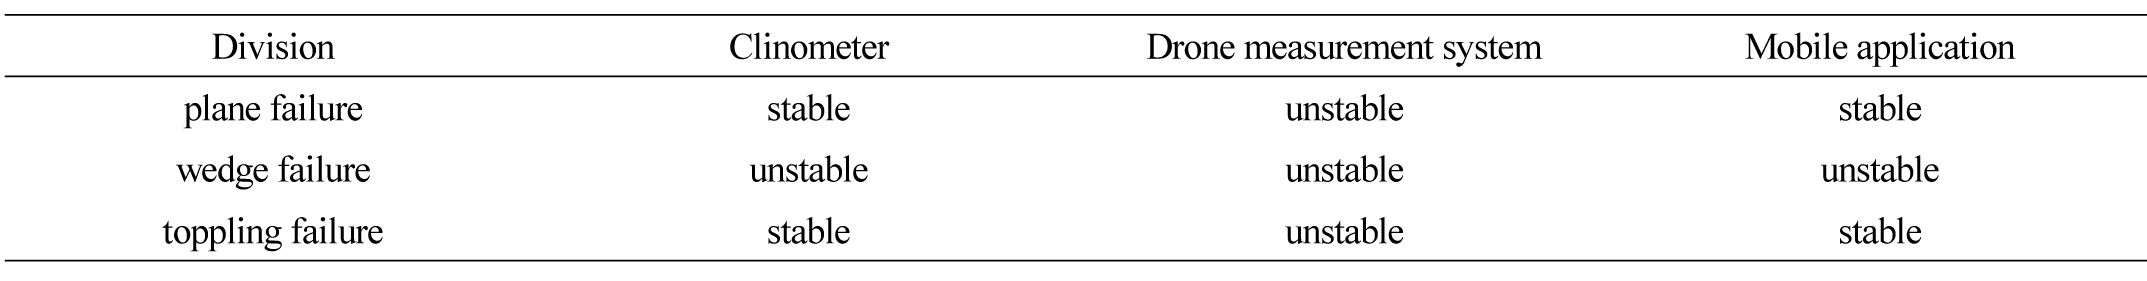
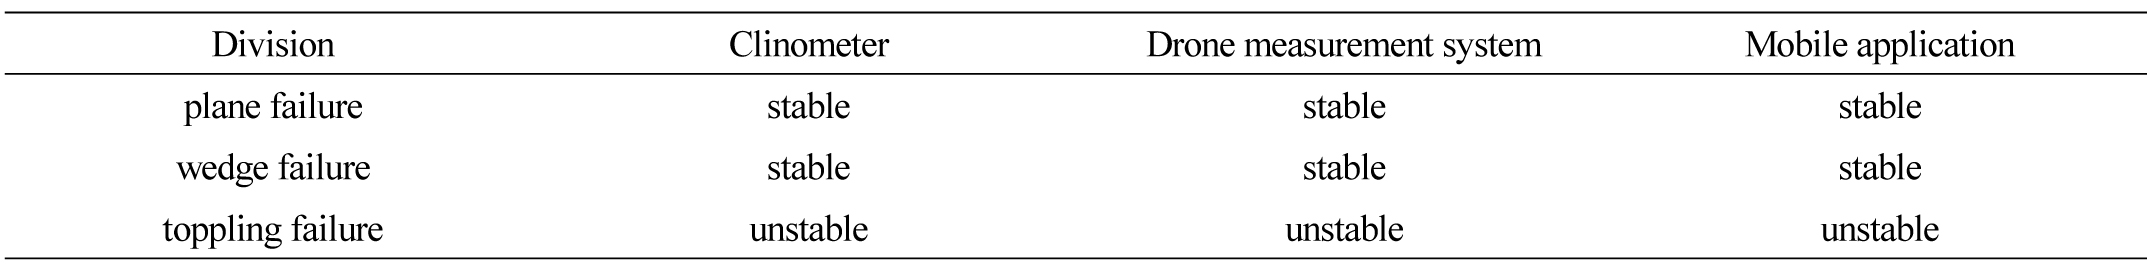
Fig. 6 and Fig. 7 indicates the destructive type of each measuring instrument according to the measurement results of joint orientation in the lab test and in the field test. For each measuring instrument, the joint stability results are shown in Table 10 and Table 11.
5. Conclusions
In this study, the orientation of joint was measured automatically using the Drone Measure System, and the reliability of joint orientation using Drone Measure System was compared with the previous joint survey method. The results of the above study are as follows.
Since the test results are for the tolerance of joint orientation measured using a clinometer, the results of the comparison and analysis show that the deviation in the joint orientation measured by the Drone Measure system is ± 3° in the lab test ± 6° in the field test. The results are considered reliable data since they are within the tolerance range of ± 7° and ± 12° in the dip and dip direction set forth in this study.
When analyzing the causes of errors, it is analyzed that errors occurred due to differences in the measurement methods of joint. When measuring the joint orientation using the Drone Measure System, the effects of refraction on the joint surface, the effects of magnetic fields, and temperature are shown to cause errors in the lab test.
The joint measurement method using Drone Measure System secured the safety of the investigator and improved the efficiency of the survey by resolving the constraints of the previous joint survey method, namely, restriction of accessibility.
The results of the stereographic projection method show that the Drone Measure system shows conservative results compared to the previous methods in the lab test.
As a result of a field test, the problem of error in ultrasonic sensors caused by the drone's propeller noise should be suggested to use a low-noise propeller, consider the effects of wind speed during field measurement, and improve flight time and battery charge of the drone.
